

Yann Neuhaus

Exploring Vector Search in Oracle 23c AI
In our data-centric world, efficiently searching and retrieving information is crucial. Traditional search methods frequently fail with the surge of unstructured data. Oracle 23c AI addresses this challenge with a groundbreaking feature: vector search. This innovative tool transforms data handling and retrieval, particularly with complex, high-dimensional datasets. In this blog post, we’ll explore the concept of vector search, its implementation in Oracle 23c AI, and its transformative impact across various industries.
Understanding Vector Search (short)Vector search, also known as similarity search or nearest neighbor search, involves searching for data points in a vector space. Unlike traditional search methods that rely on exact keyword matches, vector search leverages mathematical representations of data (vectors) to find similarities. Each data point is encoded into a vector, capturing its essential features. The search process then identifies vectors that are closest to the query vector based on a chosen distance metric, such as Euclidean distance or cosine similarity.
Oracle 23c AI integrates vector search capabilities, providing users with an advanced tool for data retrieval. Here’s a closer look at how it works and its features:
Seamless Integration: Oracle 23c AI’s vector search is integrated into the database, allowing users to perform vector searches without the need for external tools or complex workflows.
High Performance: Leveraging Oracle’s robust infrastructure, vector search in 23c AI offers high-speed search capabilities even with large datasets. Advanced indexing and optimized algorithms ensure quick and accurate retrieval.
Multi-Modal Data Support: Oracle 23c AI supports various data types, including text, images, audio, and more. This versatility makes it a powerful tool for applications across different domains.
Customizable Distance Metrics: Users can choose from a variety of distance metrics based on their specific needs, enhancing the flexibility and accuracy of the search results.
What is the flowData Ingestion: Data is ingested into the Oracle 23c AI database, where it is preprocessed and converted into vectors. This step involves using machine learning models to encode the data’s features into numerical vectors.
Indexing: The vectors are indexed to facilitate efficient searching. Oracle 23c AI uses advanced indexing techniques, such as hierarchical navigable small world (HNSW) graphs, to enable fast and scalable searches.
Querying: When a query is made, it is also converted into a vector. The vector search algorithm then identifies the closest vectors in the database using the chosen distance metric.
Results: The search results are returned, showcasing the most similar data points to the query. These results can be further refined or analyzed based on the application’s requirements.
The classical example is the image search, and classification following some criteria.
To achieve this goal Oracle can make benefit of ONNX (Open Neural Network Exchange) existent models. ONNX models offer a standardised format for representing deep learning models.
Predefined ONNX models exist for free: https://github.com/onnx/models
Building the test environmentI use an OCI VM Oracle Linux Server 9.4
I will use Python function to generate the ONNX model.
First step is to create a virtual environnement using python:
(venv) [oracle@db23-134956 ~]$ pip freeze
certifi==2024.6.2
cffi==1.16.0
charset-normalizer==3.3.2
coloredlogs==15.0.1
contourpy==1.2.1
cryptography==42.0.8
cycler==0.12.1
filelock==3.15.4
flatbuffers==24.3.25
fonttools==4.53.0
fsspec==2024.6.1
huggingface-hub==0.23.4
humanfriendly==10.0
idna==3.7
importlib_resources==6.4.0
Jinja2==3.1.4
joblib==1.4.2
kiwisolver==1.4.5
MarkupSafe==2.1.5
matplotlib==3.9.0
mpmath==1.3.0
networkx==3.3
numpy==1.26.4
nvidia-cublas-cu12==12.1.3.1
nvidia-cuda-cupti-cu12==12.1.105
nvidia-cuda-nvrtc-cu12==12.1.105
nvidia-cuda-runtime-cu12==12.1.105
nvidia-cudnn-cu12==8.9.2.26
nvidia-cufft-cu12==11.0.2.54
nvidia-curand-cu12==10.3.2.106
nvidia-cusolver-cu12==11.4.5.107
nvidia-cusparse-cu12==12.1.0.106
nvidia-nccl-cu12==2.20.5
nvidia-nvjitlink-cu12==12.5.82
nvidia-nvtx-cu12==12.1.105
oml @ file:///home/oracle/installer/client/oml-2.0-cp312-cp312-linux_x86_64.whl#sha256=0c1f7c83256f60c87f1f66b2894098bc8fefd8a60a03e67ba873661dd178b3c2
onnx==1.16.1
onnxruntime==1.18.1
onnxruntime_extensions==0.11.0
oracledb==2.2.1
packaging==24.1
pandas==2.2.2
pillow==10.4.0
protobuf==5.27.2
pycparser==2.22
pyparsing==3.1.2
python-dateutil==2.9.0.post0
pytz==2024.1
PyYAML==6.0.1
regex==2024.5.15
requests==2.32.3
safetensors==0.4.3
scikit-learn==1.5.0
scipy==1.13.1
sentencepiece==0.2.0
setuptools==70.2.0
six==1.16.0
sympy==1.12.1
threadpoolctl==3.5.0
tokenizers==0.19.1
torch==2.3.1
tqdm==4.66.4
transformers==4.42.3
typing_extensions==4.12.2
tzdata==2024.1
urllib3==2.2.2
zipp==3.19.2
I also use Oracle Database 23ai Free as docker image.
To start the docker image I use this command, and I put datafiles and archivelogs on external mount point:
(venv) [oracle@db23-134956 ~]$ docker run  -it --name 23ai -p 1700:1521 \
-v /u02/data/DB:/opt/oracle/oradata \
-v /u02/reco/DB:/opt/oracle/reco \
-e ENABLE_ARCHIVELOG=true  \
container-registry.oracle.com/database/free
Let’s get the ONX image and built it for our usage:
(venv) [oracle@db23-134956 ~]$ python
Python 3.12.1 (main, Feb 19 2024, 00:00:00) [GCC 11.4.1 20231218 (Red Hat 11.4.1-3.0.1)] on linux
Type "help", "copyright", "credits" or "license" for more information.
>>> from oml.utils import EmbeddingModel, EmbeddingModelConfig
>>> em = EmbeddingModel(model_name="sentence-transformers/all-MiniLM-L6-v2")
>>> em.export2file("all-MiniLM-L6-v2", output_dir=".")
tokenizer_config.json: 100%|██████████████████████████████████████████████████████████████████████████████████████████████████████████████████████████████████████████████████████████████████████████| 350/350 [00:00<00:00, 4.01MB/s]
vocab.txt: 100%|████████████████████████████████████████████████████████████████████████████████████████████████████████████████████████████████████████████████████████████████████████████████████| 232k/232k [00:00<00:00, 1.15MB/s]
special_tokens_map.json: 100%|████████████████████████████████████████████████████████████████████████████████████████████████████████████████████████████████████████████████████████████████████████| 112/112 [00:00<00:00, 1.52MB/s]
tokenizer.json: 100%|███████████████████████████████████████████████████████████████████████████████████████████████████████████████████████████████████████████████████████████████████████████████| 466k/466k [00:00<00:00, 1.55MB/s]
config.json: 100%|████████████████████████████████████████████████████████████████████████████████████████████████████████████████████████████████████████████████████████████████████████████████████| 612/612 [00:00<00:00, 8.23MB/s]
model.safetensors: 100%|███████████████████████████████████████████████████████████████████████████████████████████████████████████████████████████████████████████████████████████████████████████| 90.9M/90.9M [00:00<00:00, 304MB/s]
>>> exit()
l(venv) [oracle@db23-134956 ~]$ ls
all-MiniLM-L6-v2.onnx  venv
The ONNX generated file is all-MiniLM-L6-v2.onnx
Finally I copy the ONNX generated file to a shared directory to be able to import it to the database:
(venv) [oracle@db23-134956 ~]$ cp all-MiniLM-L6-v2.onnx /u02/data/DB/FREE/FREEPDB1/dump/1AC27018093909F8E063020011AC7FF6/
Let’s connect to the database and load the ONNX model into database:
(venv) [oracle@db23-134956 ~]$ sqlplus system/oracle@localhost:1700/freepdb1

SQL*Plus: Release 23.0.0.0.0 - Production on Wed Jul 3 09:12:02 2024
Version 23.4.0.24.05

SQL> create or replace directory DATA_PUMP_DIR as '/opt/oracle/oradata/FREE/FREEPDB1/dump';

Directory created.

SQL> begin
  2  dbms_vector.load_onnx_model(
  3  directory => 'DATA_PUMP_DIR'
  4  , file_name => 'all-MiniLM-L6-v2.onnx'
  5  , model_name => 'all_minilm_l6_v2'
  6  , metadata => json('{"function" : "embedding", "embeddingOutput" : "embedding" , "input": {"input": ["DATA"]}}')
  7  );
  8  end;
  9  /

PL/SQL procedure successfully completed.

-- test the loaded model
SQL> select
  model_name
  , mining_function
  , algorithm
  , (model_size/1024/1024) as model_size_mb
from user_mining_models
order by model_name;  2    3    4    5    6    7

MODEL_NAME
--------------------------------------------------------------------------------
MINING_FUNCTION 	       ALGORITHM		      MODEL_SIZE_MB
------------------------------ ------------------------------ -------------
ALL_MINILM_L6_V2
EMBEDDING		       ONNX				 86.4376068
The test table contains a word, the description end the generated vector:
-- create the table
SQL> create table my_dictionary(
 id number generated always as identity
  , word varchar2(100) not null
  , description varchar2(500) not null
  , word_vector vector not null
   );

Table created.

-- create the trigger to generate the vector
SQL> create or replace trigger my_dict_vect_build
before insert or update on my_dictionary
for each row
declare
begin
  :new.word_vector := dbms_vector_chain.utl_to_embedding(
    data => :new.word
    , params => json(q'[{"provider": "database",  2   "model": "&model_name."}]')
  );
end;
/  3    4    5    6    7    8    9   10   11
Enter value for model_name: all_minilm_l6_v2
old   8:     , params => json(q'[{"provider": "database",  2   "model": "&model_name."}]')
new   8:     , params => json(q'[{"provider": "database",  2   "model": "all_minilm_l6_v2"}]')

Trigger created.

-- create and index on the table
SQL> create vector index my_dict_ivf_idx
  on my_dictionary(word_vector)
  organization neighbor partitions
  distance cosine
  with target accuracy 95;

Index created.
I download a dictionary from the web in CSV mode as word | description from https://www.bragitoff.com/2016/03/english-dictionary-in-csv-format and I formatted it to be somehow like this :
Score;q'[To engrave, as upon a shield.]'
Score;q'[To make a score of, as points, runs, etc., in a game.]'
Score;q'[To write down in proper order and arrangement  as, to score an overture for an orchestra. See Score, n., 9.]'
Score;q'[To mark with parallel lines or scratches  as, the rocks of New England and the Western States were scored in the drift epoch.]'
Scorer;q'[One who, or that which, scores.]'
The I loaded the dictionary into a table dict using sqlldr:
SQL>

SQL> desc dict;
Name Null? Type

WORD VARCHAR2(100)
DESCRIPTION NOT NULL VARCHAR2(500)

Using these parameters files:

[oracle@0c97e3a7be16 ]$ cat ld.par
control=ld.ctl
log=ld.log
bad=ld.bad
data=ld.csv
direct=true
errors=1000000

[oracle@0c97e3a7be16 ]$ cat ld.ctl
load data into table dict
insert
fields terminated by ";"
(word,description
)
[oracle@0c97e3a7be16 1AC27018093909F8E063020011AC7FF6]$  sqlldr 'system/"Hello-World-123"@freepdb1' parfile=ld.par

SQL*Loader: Release 23.0.0.0.0 - Production on Tue Jul 9 09:47:59 2024
Version 23.4.0.24.05

Copyright (c) 1982, 2024, Oracle and/or its affiliates.  All rights reserved.

Path used:      Direct

Load completed - logical record count 54555.

Table DICT:
  19080 Rows successfully loaded.

Check the log file:
  ld.log
for more information about the load.

SQL> select count(*) from dict;

  COUNT(*)
----------
     19080
Finally insert into the final table my_dictionars. The trigger will build the vector information
SQL> insert into my_dictionary(word,DESCRIPTION)  select WORD,DESCRIPTION from dict;

19080 rows created.

SQL> commit;

Commit complete.
The ONNX model used was designed to search words. Obviously more the model is complicates mode the research is precise, and more is expensive.
The question is what are the first x words from my build dictionary which are most closely to a given word. As My dictionary contains words similar I used distinct to filter the final result.
Let’s search the result for the word “Sun”:
SQL> define search_term="Sun";

select distinct word from (
with subject as (
  select to_vector(
  vector_embedding(&model_name. using '&search_term.' as data)
  ) as search_vector
  )
  select o.word from my_dictionary o, subject s order by cosine_distance(
    o.word_vector, s.search_vector)
  fetch approx first 50 rows only with target accuracy 80);  2    3    4    5    6    7    8    9
old   4:   vector_embedding(&model_name. using '&search_term.' as data)
new   4:   vector_embedding(all_minilm_l6_v2 using 'Sun' as data)

WORD
--------------------------------------------------------------------------------
Radiant
Radiate
Light
Radiancy
Earth shine
Heat

6 rows selected.
Test for the word “Seed”:
SQL> define search_term="Seed";
SQL> /
old   4:   vector_embedding(&model_name. using '&search_term.' as data)
new   4:   vector_embedding(all_minilm_l6_v2 using 'Seed' as data)

WORD
--------------------------------------------------------------------------------
Germinate
Germination
Feeder
Grow
Germinal
Heartseed
Grass
Fertile
Fertilization
Grass-grown
Harvest
Fruit
Grower
Packfong
Pack
Agnation
Gusset

17 rows selected.
The result’s is pretty cool
ConclusionThe AI is here, everyone is using it. We are going to use it more and more. Artificial Intelligence (AI) has rapidly evolved from a theoretical concept into a transformative force across numerous industries, redefining how we interact with technology and fundamentally altering societal structures.
This example is limited, the ONNX model is simple, but shows how easy we can implemented a solution which can project into the AI world.
L’article Exploring Vector Search in Oracle 23c AI est apparu en premier sur dbi Blog.
Ansible loops: A guide from basic to advanced examples
If you are writing roles with Ansible, you must already have thought about implementing a loop, a loop of loops with Ansible, and wonder how. The ability to execute tasks in loops is primordial. This guide will provide multiple loop examples in Ansible, starting with a basic loop and progressing to more advanced scenarios.
Basic loopLet’s start with the most basic loop as an introduction.
In the following playbook, called playbook.yml, a list of numbers is created, from 1 to 5. Then a loop on the debug task displays each number.
# playbook.yml
- name: Loop examples
  hosts: localhost
  connection: local
  gather_facts: False
  tasks:
  - set_fact:
      numbers: [1,2,3,4,5]

  - name: Most basic loop
    debug:
      msg: '{{ item }}'
    loop: '{{ numbers }}'
You can test it by running the command “ansible-playbook playbook.yml”.
$ ansible-playbook playbook.yml

PLAY [Use vars from dbservers] ****************************************************************************************************************************************************************

TASK [set_fact] *******************************************************************************************************************************************************************************
ok: [localhost]

TASK [Most basic loop] ************************************************************************************************************************************************************************
ok: [localhost] => (item=1) => {
    "msg": 1
}
ok: [localhost] => (item=2) => {
    "msg": 2
}
ok: [localhost] => (item=3) => {
    "msg": 3
}
ok: [localhost] => (item=4) => {
    "msg": 4
}
ok: [localhost] => (item=5) => {
    "msg": 5
}

PLAY RECAP ************************************************************************************************************************************************************************************
localhost                  : ok=2    changed=0    unreachable=0    failed=0    skipped=0    rescued=0    ignored=0
In most use cases, you want to loop multiple tasks sequentially. The first thought is to use a block statement, but a block doesn’t accept a loop. The solution is to use “ansible.builtin.include_tasks” and loop on the task file.
The usage of loop_control is recommended to rename the loop_var name and not use “item”. See below the example with the “playbook.yml” and “loop.yml” files.
# playbook.yml
- name: Loop examples
  hosts: localhost
  connection: local
  gather_facts: False
  tasks:
  - set_fact:
      numbers: [1,2,3,4,5]

  - name: loop multiple tasks with include_task
    ansible.builtin.include_tasks:
      file: loop.yml
    loop: '{{ numbers }}'
    loop_control:
      loop_var: number
# loop.yml
- debug:
    msg: 'First task of loop.yml'

- debug:
    var: number
The results of running the playbook should be as below.
$ ansible-playbook playbook.yml

PLAY [Loop examples] **************************************************************************************************************************************************************************

TASK [set_fact] *******************************************************************************************************************************************************************************
ok: [localhost]

TASK [loop multiple tasks with include_task] **************************************************************************************************************************************************
included: /Users/kke/dbi/blog/ansible_loop/loop.yml for localhost => (item=1)
included: /Users/kke/dbi/blog/ansible_loop/loop.yml for localhost => (item=2)
included: /Users/kke/dbi/blog/ansible_loop/loop.yml for localhost => (item=3)
included: /Users/kke/dbi/blog/ansible_loop/loop.yml for localhost => (item=4)
included: /Users/kke/dbi/blog/ansible_loop/loop.yml for localhost => (item=5)

TASK [debug] **********************************************************************************************************************************************************************************
ok: [localhost] => {
    "msg": "First task of loop.yml"
}

TASK [debug] **********************************************************************************************************************************************************************************
ok: [localhost] => {
    "number": 1
}

TASK [debug] **********************************************************************************************************************************************************************************
ok: [localhost] => {
    "msg": "First task of loop.yml"
}

TASK [debug] **********************************************************************************************************************************************************************************
ok: [localhost] => {
    "number": 2
}

TASK [debug] **********************************************************************************************************************************************************************************
ok: [localhost] => {
    "msg": "First task of loop.yml"
}

TASK [debug] **********************************************************************************************************************************************************************************
ok: [localhost] => {
    "number": 3
}

TASK [debug] **********************************************************************************************************************************************************************************
ok: [localhost] => {
    "msg": "First task of loop.yml"
}

TASK [debug] **********************************************************************************************************************************************************************************
ok: [localhost] => {
    "number": 4
}

TASK [debug] **********************************************************************************************************************************************************************************
ok: [localhost] => {
    "msg": "First task of loop.yml"
}

TASK [debug] **********************************************************************************************************************************************************************************
ok: [localhost] => {
    "number": 5
}

PLAY RECAP ************************************************************************************************************************************************************************************
localhost                  : ok=16   changed=0    unreachable=0    failed=0    skipped=0    rescued=0    ignored=0
Adding a condition on the include_tasks is only evaluated once. It means that if the condition is True, it will iterate until the end even though the condition might become False, which is the intended result of the condition of include_tasks. See the following example.
# playbook.yml
- name: Loop examples
  hosts: localhost
  connection: local
  gather_facts: False
  tasks:

  - set_fact:
      numbers: [1,2,3,4,5]

  - set_fact:
      continue_task: true

  - when: continue_task == true
    name: When on include task only (evaluted at the beginning)
    ansible.builtin.include_tasks:
      file: condition.yml
    loop: '{{ numbers }}'
    loop_control:
      loop_var: number
# condition.yml
- debug:
    var: number

- when: number >= 3
  set_fact:
    continue_task: false

- debug:
    msg: 'current number: {{ number }}. Condition.yml running on number < 3'
Results of the running playbook.
$ ansible-playbook playbook.yml

PLAY [Loop examples] **************************************************************************************************************************************************************************

TASK [set_fact] *******************************************************************************************************************************************************************************
ok: [localhost]

TASK [set_fact] *******************************************************************************************************************************************************************************
ok: [localhost]

TASK [When on include task only (evaluted at the beginning)] **********************************************************************************************************************************
included: /Users/kke/dbi/blog/ansible_loop/condition.yml for localhost => (item=1)
included: /Users/kke/dbi/blog/ansible_loop/condition.yml for localhost => (item=2)
included: /Users/kke/dbi/blog/ansible_loop/condition.yml for localhost => (item=3)
included: /Users/kke/dbi/blog/ansible_loop/condition.yml for localhost => (item=4)
included: /Users/kke/dbi/blog/ansible_loop/condition.yml for localhost => (item=5)

TASK [debug] **********************************************************************************************************************************************************************************
ok: [localhost] => {
    "number": 1
}

TASK [set_fact] *******************************************************************************************************************************************************************************
skipping: [localhost]

TASK [debug] **********************************************************************************************************************************************************************************
ok: [localhost] => {
    "msg": "current number: 1. Condition.yml running on number < 3"
}

TASK [debug] **********************************************************************************************************************************************************************************
ok: [localhost] => {
    "number": 2
}

TASK [set_fact] *******************************************************************************************************************************************************************************
skipping: [localhost]

TASK [debug] **********************************************************************************************************************************************************************************
ok: [localhost] => {
    "msg": "current number: 2. Condition.yml running on number < 3"
}

TASK [debug] **********************************************************************************************************************************************************************************
ok: [localhost] => {
    "number": 3
}

TASK [set_fact] *******************************************************************************************************************************************************************************
ok: [localhost]

TASK [debug] **********************************************************************************************************************************************************************************
ok: [localhost] => {
    "msg": "current number: 3. Condition.yml running on number < 3"
}

TASK [debug] **********************************************************************************************************************************************************************************
ok: [localhost] => {
    "number": 4
}

TASK [set_fact] *******************************************************************************************************************************************************************************
ok: [localhost]

TASK [debug] **********************************************************************************************************************************************************************************
ok: [localhost] => {
    "msg": "current number: 4. Condition.yml running on number < 3"
}

TASK [debug] **********************************************************************************************************************************************************************************
ok: [localhost] => {
    "number": 5
}

TASK [set_fact] *******************************************************************************************************************************************************************************
ok: [localhost]

TASK [debug] **********************************************************************************************************************************************************************************
ok: [localhost] => {
    "msg": "current number: 5. Condition.yml running on number < 3"
}

PLAY RECAP ************************************************************************************************************************************************************************************
localhost                  : ok=20   changed=0    unreachable=0    failed=0    skipped=2    rescued=0    ignored=0
If you want the condition to apply on every task, you can either add the statement “when” on every task in “condition.yml”, or you can use the statement “apply” on “ansible.builtin.include_tasks”. Choose the solution that suits the best for the role or tasks you are writing.
The below example will use the statement “apply”.
# playbook.yml

- name: Loop examples
  hosts: localhost
  connection: local
  gather_facts: False
  tasks:

  - set_fact:
      numbers: [1,2,3,4,5]

  - set_fact:
      continue_task: true

  - name: When applied on all tasks included (evaluated each time)
    ansible.builtin.include_tasks:
      file: condition.yml
      apply:
        when: continue_task == true
    loop: '{{ numbers }}'
    loop_control:
      loop_var: number
Output of the playbook. The results should print the number until “3” but not the second debug message “current number 3. Condition.yml running on number < 3”.
$ ansible-playbook playbook.yml

PLAY [Loop examples] **************************************************************************************************************************************************************************

TASK [set_fact] *******************************************************************************************************************************************************************************
ok: [localhost]

TASK [set_fact] *******************************************************************************************************************************************************************************
ok: [localhost]

TASK [When applied on all tasks included (evalued each time)] *********************************************************************************************************************************
included: /Users/kke/dbi/blog/ansible_loop/condition.yml for localhost => (item=1)
included: /Users/kke/dbi/blog/ansible_loop/condition.yml for localhost => (item=2)
included: /Users/kke/dbi/blog/ansible_loop/condition.yml for localhost => (item=3)
included: /Users/kke/dbi/blog/ansible_loop/condition.yml for localhost => (item=4)
included: /Users/kke/dbi/blog/ansible_loop/condition.yml for localhost => (item=5)

TASK [debug] **********************************************************************************************************************************************************************************
ok: [localhost] => {
    "number": 1
}

TASK [set_fact] *******************************************************************************************************************************************************************************
skipping: [localhost]

TASK [debug] **********************************************************************************************************************************************************************************
ok: [localhost] => {
    "msg": "current number: 1. Condition.yml running on number < 3"
}

TASK [debug] **********************************************************************************************************************************************************************************
ok: [localhost] => {
    "number": 2
}

TASK [set_fact] *******************************************************************************************************************************************************************************
skipping: [localhost]

TASK [debug] **********************************************************************************************************************************************************************************
ok: [localhost] => {
    "msg": "current number: 2. Condition.yml running on number < 3"
}

TASK [debug] **********************************************************************************************************************************************************************************
ok: [localhost] => {
    "number": 3
}

TASK [set_fact] *******************************************************************************************************************************************************************************
ok: [localhost]

TASK [debug] **********************************************************************************************************************************************************************************
skipping: [localhost]

TASK [debug] **********************************************************************************************************************************************************************************
skipping: [localhost]

TASK [set_fact] *******************************************************************************************************************************************************************************
skipping: [localhost]

TASK [debug] **********************************************************************************************************************************************************************************
skipping: [localhost]

TASK [debug] **********************************************************************************************************************************************************************************
skipping: [localhost]

TASK [set_fact] *******************************************************************************************************************************************************************************
skipping: [localhost]

TASK [debug] **********************************************************************************************************************************************************************************
skipping: [localhost]

PLAY RECAP ************************************************************************************************************************************************************************************
localhost                  : ok=13   changed=0    unreachable=0    failed=0    skipped=9    rescued=0    ignored=0
In this last example, I want to make a loop of tasks. The problem is that multiple tasks may fail for multiple reasons (network, unavailability of external services, awaiting process from external services, etc.). Therefore I want to retry the task at least 5th times, before exiting the playbook run.
The example will include a commented task, to provide a more concrete real use case example. The real example is the following. Fetch the ID of an item from an external service, use this ID to fetch its status to the external service, and only proceed if the item status is completed (successful, completed) or fail the task if it returns a failure state. The task may fail on the fetch of ID (due to network issues or unavailability of the external service) and on the status fetching if it is still ongoing, which will result in retrying the whole task. Note that it is not completely optimized to make it simpler to understand and read (for example we could ignore the fetching of ID if it was already gotten in a previous iteration).
For the simplicity of the setup, a simple condition on “number” is used instead, to showcase the retry of tasks and failure of the play. It causes the playbook’s execution to fail if the number is above 3.
# playbook.yml

- name: Loop examples
  hosts: localhost
  connection: local
  gather_facts: False
  tasks:

  - set_fact:
      numbers: [1,2,3,4,5]

  - set_fact:
      continue_task: true


  - name: Example of a complex loop. Loop on number, do function(number) until suceed, or fail at the fifth attempt
    ansible.builtin.include_tasks:
      file: function.yml
    loop: '{{ numbers }}'
    loop_control:
      loop_var: number
# function.yml
- block:
    - when: init_count | default(true)
      ansible.builtin.set_fact:
        retry_count: 0

    - debug:
        msg: 'Current number is {{ number }}, and current retry count is {{ retry_count }}'

    # Do an action, use the result to do another action or checks (for example a wget, curl, or another request to get an ID)
    # For the simplicity of the example, I simply do an echo
    - name: API - get ID
      ansible.builtin.shell: 'echo {{ number }}'
      register: _api_result

    # Use the result from the precedent task
    - name: Use the ID to check another API if process is succesful
      ## An exemple of a use case, using the id
      # ansible.builtin.uri:
      #   url: 'https://example.com/status?id={{ _api_result.stdout }}'
      #   method: GET
      #   status_code: 200
      # register: _check_status
      # until:
      #   - _check_status.json is defined
      #   - _check_status.json.status in ["SUCCESSFUL", "COMPLETED", "FAILURE"]
      # failed_when: _check_status.json is not defined or _check_status.json.status in ["FAILURE"]
      # delay: '5'
      # retries: '3'

      ## For the simplicity, I just used a failed_when on debug
      debug:
        msg: 'Testing that api result is a > 3'
      failed_when: _api_result.stdout|int > 3

  rescue:
    - when: _check_status.json is defined and _check_status.json.status in ["FAILURE"]
      name: Fail if process return Failure
      ansible.builtin.fail:
        msg: status failure

    - name: Fail Task in case of total failure after a certain amount of retry
      ansible.builtin.fail:
        msg: "5 retries attempted, failed perform desired result"
      when: retry_count | int >= 5

    # Pause the playbook if necessary.
    # - ansible.builtin.pause:
    #     seconds: '5'

    - name: Increment Retry Count
      ansible.builtin.set_fact:
        retry_count: "{{ retry_count | int + 1 }}"

    # Retry the function.yml and indicate to increment the counter.
    - name: Retry function
      ansible.builtin.include_tasks: function.yml
      vars:
        init_count: false
Result of the execution.
$ ansible-playbook playbook.yml

PLAY [Loop examples] **************************************************************************************************************************************************************************

TASK [set_fact] *******************************************************************************************************************************************************************************
ok: [localhost]

TASK [set_fact] *******************************************************************************************************************************************************************************
ok: [localhost]

TASK [When applied on all tasks included (evalued each time)] *********************************************************************************************************************************
included: /Users/kke/dbi/blog/ansible_loop/condition.yml for localhost => (item=1)
included: /Users/kke/dbi/blog/ansible_loop/condition.yml for localhost => (item=2)
included: /Users/kke/dbi/blog/ansible_loop/condition.yml for localhost => (item=3)
included: /Users/kke/dbi/blog/ansible_loop/condition.yml for localhost => (item=4)
included: /Users/kke/dbi/blog/ansible_loop/condition.yml for localhost => (item=5)

TASK [debug] **********************************************************************************************************************************************************************************
ok: [localhost] => {
    "number": 1
}

TASK [set_fact] *******************************************************************************************************************************************************************************
skipping: [localhost]

TASK [debug] **********************************************************************************************************************************************************************************
ok: [localhost] => {
    "msg": "current number: 1. Condition.yml running on number < 3"
}

TASK [debug] **********************************************************************************************************************************************************************************
ok: [localhost] => {
    "number": 2
}

TASK [set_fact] *******************************************************************************************************************************************************************************
skipping: [localhost]

TASK [debug] **********************************************************************************************************************************************************************************
ok: [localhost] => {
    "msg": "current number: 2. Condition.yml running on number < 3"
}

TASK [debug] **********************************************************************************************************************************************************************************
ok: [localhost] => {
    "number": 3
}

TASK [set_fact] *******************************************************************************************************************************************************************************
ok: [localhost]

TASK [debug] **********************************************************************************************************************************************************************************
skipping: [localhost]

TASK [debug] **********************************************************************************************************************************************************************************
skipping: [localhost]

TASK [set_fact] *******************************************************************************************************************************************************************************
skipping: [localhost]

TASK [debug] **********************************************************************************************************************************************************************************
skipping: [localhost]

TASK [debug] **********************************************************************************************************************************************************************************
skipping: [localhost]

TASK [set_fact] *******************************************************************************************************************************************************************************
skipping: [localhost]

TASK [debug] **********************************************************************************************************************************************************************************
skipping: [localhost]

PLAY RECAP ************************************************************************************************************************************************************************************
localhost                  : ok=13   changed=0    unreachable=0    failed=0    skipped=9    rescued=0    ignored=0

kke@DBI-LT-KKE ansible_loop % ansible-playbook playbook.yml

PLAY [Loop examples] **************************************************************************************************************************************************************************

TASK [set_fact] *******************************************************************************************************************************************************************************
ok: [localhost]

TASK [set_fact] *******************************************************************************************************************************************************************************
ok: [localhost]

TASK [Example of a complex loop. Loop on number, do function(number) until suceed, or fail at the fifth attempt] ******************************************************************************
included: /Users/kke/dbi/blog/ansible_loop/function.yml for localhost => (item=1)
included: /Users/kke/dbi/blog/ansible_loop/function.yml for localhost => (item=2)
included: /Users/kke/dbi/blog/ansible_loop/function.yml for localhost => (item=3)
included: /Users/kke/dbi/blog/ansible_loop/function.yml for localhost => (item=4)
included: /Users/kke/dbi/blog/ansible_loop/function.yml for localhost => (item=5)

TASK [ansible.builtin.set_fact] ***************************************************************************************************************************************************************
ok: [localhost]

TASK [debug] **********************************************************************************************************************************************************************************
ok: [localhost] => {
    "msg": "Current number is 1, and current retry count is 0"
}

TASK [API - get ID] ***************************************************************************************************************************************************************************
changed: [localhost]

TASK [Use the ID to check another API if process is succesful] ********************************************************************************************************************************
ok: [localhost] => {
    "msg": "Testing that api result is a > 3"
}

TASK [ansible.builtin.set_fact] ***************************************************************************************************************************************************************
ok: [localhost]

TASK [debug] **********************************************************************************************************************************************************************************
ok: [localhost] => {
    "msg": "Current number is 2, and current retry count is 0"
}

TASK [API - get ID] ***************************************************************************************************************************************************************************
changed: [localhost]

TASK [Use the ID to check another API if process is succesful] ********************************************************************************************************************************
ok: [localhost] => {
    "msg": "Testing that api result is a > 3"
}

TASK [ansible.builtin.set_fact] ***************************************************************************************************************************************************************
ok: [localhost]

TASK [debug] **********************************************************************************************************************************************************************************
ok: [localhost] => {
    "msg": "Current number is 3, and current retry count is 0"
}

TASK [API - get ID] ***************************************************************************************************************************************************************************
changed: [localhost]

TASK [Use the ID to check another API if process is succesful] ********************************************************************************************************************************
ok: [localhost] => {
    "msg": "Testing that api result is a > 3"
}

TASK [ansible.builtin.set_fact] ***************************************************************************************************************************************************************
ok: [localhost]

TASK [debug] **********************************************************************************************************************************************************************************
ok: [localhost] => {
    "msg": "Current number is 4, and current retry count is 0"
}

TASK [API - get ID] ***************************************************************************************************************************************************************************
changed: [localhost]

TASK [Use the ID to check another API if process is succesful] ********************************************************************************************************************************
fatal: [localhost]: FAILED! => {
    "msg": "Testing that api result is a > 3"
}

TASK [Fail if process return Failure] *********************************************************************************************************************************************************
skipping: [localhost]

TASK [Fail Task in case of total failure after a certain amount of retry] *********************************************************************************************************************
skipping: [localhost]

TASK [Increment Retry Count] ******************************************************************************************************************************************************************
ok: [localhost]

TASK [Retry function] *************************************************************************************************************************************************************************
included: /Users/kke/dbi/blog/ansible_loop/function.yml for localhost

TASK [ansible.builtin.set_fact] ***************************************************************************************************************************************************************
skipping: [localhost]

TASK [debug] **********************************************************************************************************************************************************************************
ok: [localhost] => {
    "msg": "Current number is 4, and current retry count is 1"
}

TASK [API - get ID] ***************************************************************************************************************************************************************************
changed: [localhost]

TASK [Use the ID to check another API if process is succesful] ********************************************************************************************************************************
fatal: [localhost]: FAILED! => {
    "msg": "Testing that api result is a > 3"
}

TASK [Fail if process return Failure] *********************************************************************************************************************************************************
skipping: [localhost]

TASK [Fail Task in case of total failure after a certain amount of retry] *********************************************************************************************************************
skipping: [localhost]

TASK [Increment Retry Count] ******************************************************************************************************************************************************************
ok: [localhost]

TASK [Retry function] *************************************************************************************************************************************************************************
included: /Users/kke/dbi/blog/ansible_loop/function.yml for localhost

TASK [ansible.builtin.set_fact] ***************************************************************************************************************************************************************
skipping: [localhost]

TASK [debug] **********************************************************************************************************************************************************************************
ok: [localhost] => {
    "msg": "Current number is 4, and current retry count is 2"
}

TASK [API - get ID] ***************************************************************************************************************************************************************************
changed: [localhost]

TASK [Use the ID to check another API if process is succesful] ********************************************************************************************************************************
fatal: [localhost]: FAILED! => {
    "msg": "Testing that api result is a > 3"
}

TASK [Fail if process return Failure] *********************************************************************************************************************************************************
skipping: [localhost]

TASK [Fail Task in case of total failure after a certain amount of retry] *********************************************************************************************************************
skipping: [localhost]

TASK [Increment Retry Count] ******************************************************************************************************************************************************************
ok: [localhost]

TASK [Retry function] *************************************************************************************************************************************************************************
included: /Users/kke/dbi/blog/ansible_loop/function.yml for localhost

TASK [ansible.builtin.set_fact] ***************************************************************************************************************************************************************
skipping: [localhost]

TASK [debug] **********************************************************************************************************************************************************************************
ok: [localhost] => {
    "msg": "Current number is 4, and current retry count is 3"
}

TASK [API - get ID] ***************************************************************************************************************************************************************************
changed: [localhost]

TASK [Use the ID to check another API if process is succesful] ********************************************************************************************************************************
fatal: [localhost]: FAILED! => {
    "msg": "Testing that api result is a > 3"
}

TASK [Fail if process return Failure] *********************************************************************************************************************************************************
skipping: [localhost]

TASK [Fail Task in case of total failure after a certain amount of retry] *********************************************************************************************************************
skipping: [localhost]

TASK [Increment Retry Count] ******************************************************************************************************************************************************************
ok: [localhost]

TASK [Retry function] *************************************************************************************************************************************************************************
included: /Users/kke/dbi/blog/ansible_loop/function.yml for localhost

TASK [ansible.builtin.set_fact] ***************************************************************************************************************************************************************
skipping: [localhost]

TASK [debug] **********************************************************************************************************************************************************************************
ok: [localhost] => {
    "msg": "Current number is 4, and current retry count is 4"
}

TASK [API - get ID] ***************************************************************************************************************************************************************************
changed: [localhost]

TASK [Use the ID to check another API if process is succesful] ********************************************************************************************************************************
fatal: [localhost]: FAILED! => {
    "msg": "Testing that api result is a > 3"
}

TASK [Fail if process return Failure] *********************************************************************************************************************************************************
skipping: [localhost]

TASK [Fail Task in case of total failure after a certain amount of retry] *********************************************************************************************************************
skipping: [localhost]

TASK [Increment Retry Count] ******************************************************************************************************************************************************************
ok: [localhost]

TASK [Retry function] *************************************************************************************************************************************************************************
included: /Users/kke/dbi/blog/ansible_loop/function.yml for localhost

TASK [ansible.builtin.set_fact] ***************************************************************************************************************************************************************
skipping: [localhost]

TASK [debug] **********************************************************************************************************************************************************************************
ok: [localhost] => {
    "msg": "Current number is 4, and current retry count is 5"
}

TASK [API - get ID] ***************************************************************************************************************************************************************************
changed: [localhost]

TASK [Use the ID to check another API if process is succesful] ********************************************************************************************************************************
fatal: [localhost]: FAILED! => {
    "msg": "Testing that api result is a > 3"
}

TASK [Fail if process return Failure] *********************************************************************************************************************************************************
skipping: [localhost]

TASK [Fail Task in case of total failure after a certain amount of retry] *********************************************************************************************************************
fatal: [localhost]: FAILED! => {"changed": false, "msg": "5 retries attempted, failed perform desired result"}

PLAY RECAP ************************************************************************************************************************************************************************************
localhost                  : ok=42   changed=9    unreachable=0    failed=1    skipped=16   rescued=6    ignored=0
Loop is a necessity in IT, the base for automation. At first, it might be disorientating with Ansible, but it becomes quite easy to understand and use with a little practice. The official documentation provided by Ansible also covers a lot and explains well the concept of loop, it will be your best friend in your journey to master Ansible.
LinksAnsible – Official documentation
Blog – Faster Ansible
Blog – Ansible Automates – Event Driven & Lightspeed
Blog – Specify hosts in ansible-playbook command line
Blog – Ansible Event Driven Automation
Blog – Create and manage Ansible Execution Environments
L’article Ansible loops: A guide from basic to advanced examples est apparu en premier sur dbi Blog.
CloudNativePG – Storage
This is the next post in the series about CloudNativePG (the previous one are here, here, here, here, here and here). In this post we’ll look at storage, and if you ask me, this is the most important topic when it comes to deploying PostgreSQL on Kubernetes. In the past we’ve seen a lot of deployments which used NFS as a shared storage for their deployments. While this works, it is usually not a good choice for PostgreSQL workloads in such a setup, and this is because of performance. But a lot of things changed in the recent years, and today there is plenty of choice when it comes to storage with Kubernetes.
What you usually have with PostgreSQL, is a streaming replication setup as we’ve seen it in the previous posts. In such a setup there is no need for shared storage, as data is replicated by PostgreSQL. This means you need persistent local storage, which means local storage on the Kubernetes worker nodes. This storage is then mapped into the containers and can be used by PostgreSQL to store data persistently. Using the CSI (Container Storage Interface) everybody can plugin some kind of storage into the Kubernetes system and containers can then use this for storing their data. You can find a list of storage drivers here.
As mentioned in the CloudNativePG documentation, you should chose a driver which supports snapshots, because this is used for backing up your PostgreSQL instance. What we’ve tested recently at dbi services is OpenEBS and this gave very good results. This solution comes with two types of storage services, local and replicated. As we don’t need a replicated storage for the PostgreSQL deployment, we’ll obviously go for the local one. There are additional choices for the local one, which are LVM, ZFS or raw device. For our use case, LVM fits best, so let’s start by setting this up.
In all the previous posts we’ve used minicube, but as this is a single node deployment I’ve changed my environment to a more production grade setup by deploying a vanilla Kubernetes with one Control Plane and three Worker Nodes (in a real production setup you should have three ore more Control Planes for high availability):
k8s@k8s1:~$ kubectl get nodes
NAME                       STATUS   ROLES           AGE     VERSION
k8s1                       Ready    control-plane   4d23h   v1.30.2
k8s2.it.dbi-services.com   Ready    worker          4d23h   v1.30.2
k8s3.it.dbi-services.com   Ready    worker          4d23h   v1.30.2
k8s4.it.dbi-services.com   Ready    worker          4d23h   v1.30.2
The CloudNativePG operator and the Kubernetes Dashboard are already deployed (Calico is the network component):
k8s@k8s1:~$ kubectl get pods -A
NAMESPACE              NAME                                                    READY   STATUS    RESTARTS       AGE
cnpg-system            cnpg-controller-manager-6ddc45757d-fql27                1/1     Running   1 (24m ago)    4d19h
kube-system            calico-kube-controllers-564985c589-jtm5j                1/1     Running   1 (24m ago)    4d22h
kube-system            calico-node-52qxf                                       1/1     Running   1 (24m ago)    4d22h
kube-system            calico-node-6f4v4                                       1/1     Running   1 (24m ago)    4d22h
kube-system            calico-node-jfj7s                                       1/1     Running   1 (24m ago)    4d22h
kube-system            calico-node-l92mf                                       1/1     Running   1 (24m ago)    4d22h
kube-system            coredns-7db6d8ff4d-98x5z                                1/1     Running   1 (24m ago)    4d23h
kube-system            coredns-7db6d8ff4d-mf7xq                                1/1     Running   1 (24m ago)    4d23h
kube-system            etcd-k8s1                                               1/1     Running   20 (24m ago)   4d23h
kube-system            kube-apiserver-k8s1                                     1/1     Running   19 (24m ago)   4d23h
kube-system            kube-controller-manager-k8s1                            1/1     Running   26 (24m ago)   4d23h
kube-system            kube-proxy-h6fsv                                        1/1     Running   1 (24m ago)    4d23h
kube-system            kube-proxy-jqmkl                                        1/1     Running   1 (24m ago)    4d23h
kube-system            kube-proxy-sz9lx                                        1/1     Running   1 (24m ago)    4d23h
kube-system            kube-proxy-wg7nx                                        1/1     Running   1 (24m ago)    4d23h
kube-system            kube-scheduler-k8s1                                     1/1     Running   29 (24m ago)   4d23h
kubernetes-dashboard   kubernetes-dashboard-api-bf787c6f4-2c4bw                1/1     Running   1 (24m ago)    4d22h
kubernetes-dashboard   kubernetes-dashboard-auth-6765c66c7c-7xzbx              1/1     Running   1 (24m ago)    4d22h
kubernetes-dashboard   kubernetes-dashboard-kong-7696bb8c88-cc462              1/1     Running   1 (24m ago)    4d22h
kubernetes-dashboard   kubernetes-dashboard-metrics-scraper-5485b64c47-cz75d   1/1     Running   1 (24m ago)    4d22h
kubernetes-dashboard   kubernetes-dashboard-web-84f8d6fff4-vzdcw               1/1     Running   1 (24m ago)    4d22h
For being able able to create a LVM physical volume, there is an additional small disk (vdb) on all the worker nodes:
k8s@k8s1:~$ ssh k8s2 'lsblk'
NAME   MAJ:MIN RM  SIZE RO TYPE MOUNTPOINTS
sr0     11:0    1 1024M  0 rom
vda    254:0    0   20G  0 disk
├─vda1 254:1    0   19G  0 part /
├─vda2 254:2    0    1K  0 part
└─vda5 254:5    0  975M  0 part
vdb    254:16   0    5G  0 disk
k8s@k8s1:~$ ssh k8s3 'lsblk'
NAME   MAJ:MIN RM  SIZE RO TYPE MOUNTPOINTS
sr0     11:0    1 1024M  0 rom
vda    254:0    0   20G  0 disk
├─vda1 254:1    0   19G  0 part /
├─vda2 254:2    0    1K  0 part
└─vda5 254:5    0  975M  0 part
vdb    254:16   0    5G  0 disk
k8s@k8s1:~$ ssh k8s4 'lsblk'
NAME   MAJ:MIN RM  SIZE RO TYPE MOUNTPOINTS
sr0     11:0    1 1024M  0 rom
vda    254:0    0   20G  0 disk
├─vda1 254:1    0   19G  0 part /
├─vda2 254:2    0    1K  0 part
└─vda5 254:5    0  975M  0 part
vdb    254:16   0    5G  0 disk
As LVM is not installed by default in a Debian 12 minimal installation (which is used here on all the nodes), this needs to be installed:
k8s@k8s1:~$ ssh k8s2 'sudo apt install -y lvm2'
k8s@k8s1:~$ ssh k8s3 'sudo apt install -y lvm2'
k8s@k8s1:~$ ssh k8s4 'sudo apt install -y lvm2'
Now the physical volume and the volume group can be created, on all the worker nodes:
k8s@k8s1:~$ ssh k8s2 'sudo pvcreate /dev/vdb'
  Physical volume "/dev/vdb" successfully created.
k8s@k8s1:~$ ssh k8s3 'sudo pvcreate /dev/vdb'
  Physical volume "/dev/vdb" successfully created.
k8s@k8s1:~$ ssh k8s4 'sudo pvcreate /dev/vdb'
  Physical volume "/dev/vdb" successfully created.
k8s@k8s1:~$ ssh k8s2 'sudo vgcreate vgopenebs /dev/vdb'
  Volume group "vgopenebs" successfully created
k8s@k8s1:~$ ssh k8s3 'sudo vgcreate vgopenebs /dev/vdb'
  Volume group "vgopenebs" successfully created
k8s@k8s1:~$ ssh k8s4 'sudo vgcreate vgopenebs /dev/vdb'
  Volume group "vgopenebs" successfully created
k8s@k8s1:~$ ssh k8s2 'sudo vgs'
  VG        #PV #LV #SN Attr   VSize  VFree
  vgopenebs   1   0   0 wz--n- <5.00g <5.00g
That’s it from the LVM side. The next step is to install the OpenEBS LVM2 LocalPV-LVM driver, which is done with Helm:
k8s@k8s1:~$ helm repo add openebs https://openebs.github.io/openebs
"openebs" has been added to your repositories
k8s@k8s1:~$ helm repo update
Hang tight while we grab the latest from your chart repositories...
...Successfully got an update from the "openebs" chart repository
...Successfully got an update from the "kubernetes-dashboard" chart repository
Update Complete. ⎈Happy Helming!⎈
k8s@k8s1:~$ helm install openebs --namespace openebs openebs/openebs --create-namespace
NAME: openebs
LAST DEPLOYED: Wed Jun 19 08:43:14 2024
NAMESPACE: openebs
STATUS: deployed
REVISION: 1
NOTES:
Successfully installed OpenEBS.

Check the status by running: kubectl get pods -n openebs

The default values will install both Local PV and Replicated PV. However,
the Replicated PV will require additional configuration to be fuctional.
The Local PV offers non-replicated local storage using 3 different storage
backends i.e HostPath, LVM and ZFS, while the Replicated PV provides one replicated highly-available
storage backend i.e Mayastor.

For more information,
- view the online documentation at https://openebs.io/docs
- connect with an active community on our Kubernetes slack channel.
        - Sign up to Kubernetes slack: https://slack.k8s.io
        - #openebs channel: https://kubernetes.slack.com/messages/openebs
By looking at what’s happening in the “openebs” namespace, we can see that OpenEBS is being deployed and created:
k8s@k8s1:~$ kubectl get pods -n openebs
NAME                                              READY   STATUS              RESTARTS   AGE
init-pvc-1f4f8c25-5523-44f4-94ad-8aa896bcd382     0/1     ContainerCreating   0          53s
init-pvc-39544e8c-3c0c-4b0b-ba07-dd23502acaa1     0/1     ContainerCreating   0          53s
init-pvc-5ebe4c41-9f77-408c-afde-0a2213c10f0f     0/1     ContainerCreating   0          53s
init-pvc-a33f5f49-7366-4f0d-986b-c8a282bde36e     0/1     ContainerCreating   0          53s
openebs-agent-core-b48f4fbc4-r94wc                0/2     Init:0/1            0          71s
openebs-agent-ha-node-89fcp                       0/1     Init:0/1            0          71s
openebs-agent-ha-node-bn7wt                       0/1     Init:0/1            0          71s
openebs-agent-ha-node-w574q                       0/1     Init:0/1            0          71s
openebs-api-rest-74954d444-cdfwt                  0/1     Init:0/2            0          71s
openebs-csi-controller-5d4fc97648-znvph           0/6     Init:0/1            0          71s
openebs-csi-node-2kwlx                            0/2     Init:0/1            0          71s
openebs-csi-node-8sct6                            0/2     Init:0/1            0          71s
openebs-csi-node-bjknj                            0/2     Init:0/1            0          71s
openebs-etcd-0                                    0/1     Pending             0          71s
openebs-etcd-1                                    0/1     Pending             0          71s
openebs-etcd-2                                    0/1     Pending             0          71s
openebs-localpv-provisioner-7cd9f85f8f-5vnvp      1/1     Running             0          71s
openebs-loki-0                                    0/1     Pending             0          71s
openebs-lvm-localpv-controller-64946b785c-dnvh4   0/5     ContainerCreating   0          71s
openebs-lvm-localpv-node-42n8f                    0/2     ContainerCreating   0          71s
openebs-lvm-localpv-node-h47r8                    0/2     ContainerCreating   0          71s
openebs-lvm-localpv-node-ndgwk                    2/2     Running             0          71s
openebs-nats-0                                    0/3     ContainerCreating   0          71s
openebs-nats-1                                    0/3     ContainerCreating   0          71s
openebs-nats-2                                    0/3     ContainerCreating   0          71s
openebs-obs-callhome-5b7fdb675-8f85b              0/2     ContainerCreating   0          71s
openebs-operator-diskpool-794596c9b7-jtg5t        0/1     Init:0/2            0          71s
openebs-promtail-2mfgt                            1/1     Running             0          71s
openebs-promtail-8np7q                            0/1     ContainerCreating   0          71s
openebs-promtail-lv4ht                            1/1     Running             0          71s
openebs-zfs-localpv-controller-7fdcd7f65-mnnhf    0/5     ContainerCreating   0          71s
openebs-zfs-localpv-node-6pd4v                    2/2     Running             0          71s
openebs-zfs-localpv-node-c5vld                    0/2     ContainerCreating   0          71s
openebs-zfs-localpv-node-kqxrg                    0/2     ContainerCreating   0          71s
After a while, you should see the following state:
k8s@k8s1:~$ kubectl get pods -n openebs -l role=openebs-lvm
NAME                                              READY   STATUS    RESTARTS   AGE
openebs-lvm-localpv-controller-64946b785c-dnvh4   5/5     Running   0          12m
openebs-lvm-localpv-node-42n8f                    2/2     Running   0          12m
openebs-lvm-localpv-node-h47r8                    2/2     Running   0          12m
openebs-lvm-localpv-node-ndgwk                    2/2     Running   0          12m
Now we are ready to create the storage class:
- We want the storage class to be named “openebs-lvmpv”
- We want to allow volume expansion
- We reference the volume group we’ve created above
- We want ext4 as the file system
- We restrict this to our worker nodes
k8s@k8s1:~$ cat sc.yaml
apiVersion: storage.k8s.io/v1
kind: StorageClass
metadata:
  name: openebs-lvmpv
allowVolumeExpansion: true
parameters:
  storage: "lvm"
  volgroup: "vgopenebs"
  fsType: "ext4"
provisioner: local.csi.openebs.io
allowedTopologies:
- matchLabelExpressions:
  - key: kubernetes.io/hostname
    values:
      - k8s2.it.dbi-services.com
      - k8s3.it.dbi-services.com
      - k8s4.it.dbi-services.com

k8s@k8s1:~$ kubectl apply -f sc.yaml
storageclass.storage.k8s.io/openebs-lvmpv created
k8s@k8s1:~$ kubectl get sc
NAME                     PROVISIONER               RECLAIMPOLICY   VOLUMEBINDINGMODE      ALLOWVOLUMEEXPANSION   AGE
mayastor-etcd-localpv    openebs.io/local          Delete          WaitForFirstConsumer   false                  21m
mayastor-loki-localpv    openebs.io/local          Delete          WaitForFirstConsumer   false                  21m
openebs-hostpath         openebs.io/local          Delete          WaitForFirstConsumer   false                  21m
openebs-lvmpv            local.csi.openebs.io      Delete          Immediate              true                   22s
openebs-single-replica   io.openebs.csi-mayastor   Delete          Immediate              true                   21m
Once this is ready we need to modify our cluster definition to use the new storage class by adding a PVC template:
apiVersion: postgresql.cnpg.io/v1
kind: Cluster
metadata:
  name: my-pg-cluster
spec:
  instances: 3

  bootstrap:
    initdb:
      database: db1
      owner: db1
      dataChecksums: true
      walSegmentSize: 32
      localeCollate: 'en_US.utf8'
      localeCType: 'en_US.utf8'
      postInitSQL:
      - create user db2
      - create database db2 with owner = db2
  storage:
    pvcTemplate:
      accessModes:
        - ReadWriteOnce
      resources:
        requests:
          storage: 1Gi
      storageClassName: openebs-lvmpv
      volumeMode: Filesystem
As usual deploy the cluster and wait until the pods are up and running:
k8s@k8s1:~$ kubectl apply -f pg.yaml
cluster.postgresql.cnpg.io/my-pg-cluster created
k8s@k8s1:~$ kubectl get pods
NAME              READY   STATUS    RESTARTS   AGE
my-pg-cluster-1   1/1     Running   0          2m55s
my-pg-cluster-2   1/1     Running   0          111s
my-pg-cluster-3   1/1     Running   0          52s
If you go to one of the worker nodes, you can see the mount and it’s content:
root@k8s2:/home/k8s$ df -h | grep ebs
/dev/mapper/vgopenebs-pvc--2bcc48bc--4600--4c6a--a13f--6dfc1e9ea081  974M  230M  728M  24% /var/lib/kubelet/pods/5b9441b5-039e-4a75-8865-0ccd053f08fc/volumes/kubernetes.io~csi/pvc-2bcc48bc-4600-4c6a-a13f-6dfc1e9ea081/mount
root@k8s2:/home/k8s$ ls /var/lib/kubelet/pods/5b9441b5-039e-4a75-8865-0ccd053f08fc/volumes/kubernetes.io~csi/pvc-2bcc48bc-4600-4c6a-a13f-6dfc1e9ea081/mount
lost+found  pgdata
root@k8s2:/home/k8s$ ls /var/lib/kubelet/pods/5b9441b5-039e-4a75-8865-0ccd053f08fc/volumes/kubernetes.io~csi/pvc-2bcc48bc-4600-4c6a-a13f-6dfc1e9ea081/mount/pgdata/
base              global         pg_dynshmem    pg_logical    pg_replslot   pg_stat      pg_tblspc    pg_wal                postgresql.conf
current_logfiles  override.conf  pg_hba.conf    pg_multixact  pg_serial     pg_stat_tmp  pg_twophase  pg_xact               postmaster.opts
custom.conf       pg_commit_ts   pg_ident.conf  pg_notify     pg_snapshots  pg_subtrans  PG_VERSION   postgresql.auto.conf  postmaster.pid
As mentioned initially: The storage part is critical and you need to carefully select what you want to use and really test it. This will be the topic for the next post.
L’article CloudNativePG – Storage est apparu en premier sur dbi Blog.
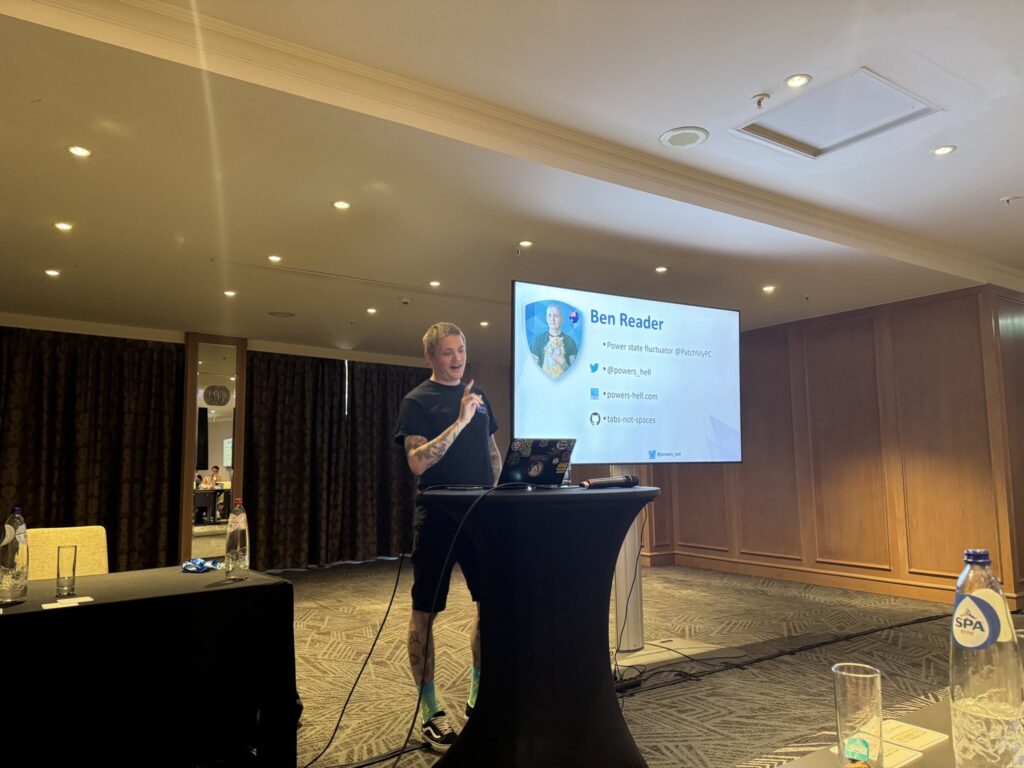
Insights from PowerShell Conference EU: Managing IT Environments with SSH & PowerShell
A session presented by Ben Reader.
At the recent PowerShell Conference EU in Antwerp, IT professionals from around the world gathered to explore the latest advancements in PowerShell and its integration with other tools. One of the standout sessions focused on the powerful combination of SSH and PowerShell, providing a unified toolkit that revolutionizes the management of mixed IT environments.
A New Era for Windows Management with SSH
Traditionally, SSH has been the standard protocol for remote management in Linux environments due to its robust security and simplicity. The introduction of SSH support in Windows, particularly with PowerShell 7, marked a significant milestone. This session highlighted how Windows administrators can now leverage the same reliable protocol used in Linux, streamlining the management of mixed environments.
Simple Setup for Seamless Management
During this session, animated by Ben Reader, showed us how setting up SSH on a Windows Server 2025 machine:
- Installation: SSH server and client are included by default but need to be enabled.
- Activation: Simple commands get SSH up and running, eliminating complex setup processes.
- Firewall Configuration: Adjusting firewall rules to allow SSH traffic ensures both security and accessibility.
PowerShell: The Cross-Platform Unifier
Ben emphasized the real magic that happens when combining SSH with PowerShell. Configuring it as the default shell for SSH sessions creates a consistent environment across Windows, Linux, and Mac systems, reducing context switches and errors, and enhancing productivity.
For Windows, this involves a registry tweak:
Set-ItemProperty -Path "HKLM:\Software\OpenSSH" -Name "DefaultShell" -Value "C:\Program Files\PowerShell\7\pwsh.exe"A little demo for Linux and Mac, setting the default shell using the chsh command was demonstrated. As I’m not a Linux/Mac user I cannot provide you how things has been made, but in few code lines, Ben showed us how it’s easy to implement.
Advanced Functionalities for Enhanced Management
During the session, Ben delved into advanced functionalities that SSH and PowerShell offer:
- Passwordless Access: Implementing key-based authentication enhances security and simplifies password management.
- PS Remoting with SSH: This combination allows for secure and efficient remote system management.
- Port Tunneling: Demonstrated as a versatile technique to securely access resources, enhancing network management flexibility.
Practical application
One of the highlights was a live demonstration showing how to configure a new Windows Server 2025 instance with SSH and PowerShell:
# Install OpenSSH components
Add-WindowsCapability -Online -Name OpenSSH.Server
Add-WindowsCapability -Online -Name OpenSSH.Client

# Start and configure SSH service
Start-Service sshd
Set-Service -Name sshd -StartupType 'Automatic'

# Allow SSH in firewall
New-NetFirewallRule -Name sshd -DisplayName 'OpenSSH Server (sshd)' -Enabled True -Direction Inbound -Protocol TCP -Action Allow -LocalPort 22

# Set PowerShell as the default shell
Set-ItemProperty -Path "HKLM:\Software\OpenSSH" -Name "DefaultShell" -Value "C:\Program Files\PowerShell\7\pwsh.exe"
These steps transformed a fresh Windows server into an SSH-enabled powerhouse, ready to handle remote management tasks efficiently and securely.
Conclusion: Unified Tools for the Future In this session, Ben reinforced the value of incorporating SSH and PowerShell into IT management toolkits. Standardizing tools across different environments reduces downtime, enhances security, and boosts productivity. Highlighting that the future of IT management is unified, and SSH with PowerShell is leading the way.
L’article Insights from PowerShell Conference EU: Managing IT Environments with SSH & PowerShell est apparu en premier sur dbi Blog.
Exploring Project Mercury: An Experience with Agent Creation and Cross-Platform Capabilities
First of all, i would like to thank Geoffroy Dubreuil and Gael Colas for this amazing event and all the work the did for this to be possible
I also want to thank dbi Services for their trust and Nathan Courtine for his help and great advices.
Hey everyone!
I recently had the opportunity to attend the PowerShell conference in Antwerp. This was an amazing journey and I got to assist different conferences I want to share with you some of them.
I will present you in different blog some insights I got from it because I learned a lot of things from those incredibly passionate speakers. All of them shared their experiences, some technical like the one I will present you today; some were more reflexions about how to use technology that the world offer us, like AI, to improve our daily lives.
In today blog, we will talk about Project Mercury, a presentation made by Steven Bucher & Damien Caro. An experimental initiative that’s set to “revolutionize” agent creation and distribution. Whether you’re a seasoned developer or just starting out, this project aims to ignite your creativity and excitement about building agents. I’m excited to share my journey and insights from this conference with you all!
Introduction to Project Mercury
Project Mercury is all about innovation and experimentation. While it’s still in the early stages and not yet as streamlined as other tools, the goal is to introduce groundbreaking ideas that will improve user experiences and spark brainstorming sessions. This project is a playground for new concepts, and it was thrilling to see its potential.
Enhancing the Agent Shell Experience
One of the standout features of Project Mercury is its cross-platform and cross-shell compatibility. Here’s what makes it so versatile:
- Cross-Platform Support:
- Whether you’re using Windows Terminal or a terminal on a Mac, Project Mercury works seamlessly across different operating systems.
- Predictive IntelliSense:
- For those using PowerShell 7, the predictive IntelliSense feature offers an enhanced interactive experience. It helps you write commands more efficiently by predicting what you might type next.
- Versatility Across Shells:
- You can use Project Mercury with various command-line interfaces, including cmd.exe and bash. However, the full suite of features is optimized for PowerShell 7.
Demo: Bringing It All Together
To see Project Mercury in action, we walked through a quick demo during the conference:
- Starting the Agent Interface:
- Launching the agent interface is simple, and it works across different environments. This makes it easy to switch between different operating systems and shells.
- Using the Olama Agent:
- We explored the Olama agent as an example, demonstrating its capabilities and how to configure it for optimal performance.
- Cross-Shell Functionality:
- The demo highlighted how Project Mercury can be used in various shells, making it a versatile tool for any setup. While some features are exclusive to PowerShell 7, the basic functionalities are available across different platforms.
Troubleshooting Tips
No project is without its challenges. Here are a few tips shared during the conference to help troubleshoot common issues:
- Path Specifications:
- Ensure you specify the correct path if the agent interface isn’t recognized.
- Python Package Conflicts:
- If you encounter issues related to Python packages, double-check your environment configurations.
- Windows PowerShell Compatibility:
- While you can run the agent interface in older versions of PowerShell, note that some advanced features may not be available.
Conclusion
Project Mercury is an exciting venture into the world of agent creation and cross-platform tools. With its innovative approach and flexible framework, it promises to open up new possibilities for developers everywhere. Whether you’re experimenting with new ideas or looking to streamline your development process, Project Mercury offers the tools and inspiration you need. Stay tuned for more updates and happy coding!
L’article Exploring Project Mercury: An Experience with Agent Creation and Cross-Platform Capabilities est apparu en premier sur dbi Blog.
Cleanup Audit Trail – the Full Picture
Oracle Database 23ai introduces several enhancements to unified auditing, focused on flexibility, and effectiveness. Some of the new key features are:
Desupport of Traditional Auditing: Traditional auditing is desupported in Oracle 23ai, which means all auditing must now be done using unified auditing. Unified auditing consolidates audit records into a single, secure trail and supports conditional policies for selective auditing.
Column-Level Audit Policies: One of the most notable features is the ability to create audit policies on individual columns of tables and views. This granularity control allows organizations to focus their audit efforts on the most sensitive data elements, reducing the volume of audit data and enhancing security by targeting specific actions like SELECT, INSERT, UPDATE, or DELETE on specified columns. It can be implemented like:
conn / as sysdba
noaudit policy test_audit_policy;
drop audit policy test_audit_policy;
create audit policy test_audit_policy
	actions update(col1, col2) on userx.audit_test_tab,
	select(col2) on userx.audit_test_tab
	container = current;
audit policy test_audit_policy;
Enhanced Integration with IAM and Cloud Services: Oracle 23ai includes improved authentication and authorization capabilities for IAM users, supporting Azure AD OAuth2 tokens and allowing seamless integration with Oracle Autonomous Database on Dedicated Exadata Infrastructure.
New Cryptographic Algorithms and Security Enhancements: The release includes support for new cryptographic algorithms such as SM2, SM3, SM4, and SHA-3, along with enhancements to the DBMS_CRYPTO package and orapki utility.
Consolidation of FIPS 140 Parameter: Oracle 23c introduces a unified FIPS_140 parameter for configuring FIPS across various database environments, including Transparent Data Encryption (TDE) and network encryption, streamlining the compliance process and improving security management.
Also for the reason that unified audit is now standard, I would like to summarize the management and cleanup of the audit trail in detail here:
First of all you should check the size of the existing audit tables (AUD$ and FGA_LOG$), create a new audit-tablespace for the audit tables:
set lin 999
set pages 999
col tablespace_name for a30
col segment_name for a30
col owner for a20
select owner, segment_name, tablespace_name, bytes/1024/1024 MB
from dba_segments
where segment_name in ('AUD$', 'FGA_LOG$');
-- create audit tablespace
create tablespace audit_ts;
select file_name, file_id, tablespace_name, autoextensible, maxbytes/1024/1024/1024 GB
from dba_data_files
where tablespace_name like 'AUD$';
-- alter database datafile … autoextend on next 100M maxsize 1G;
-- eventually create an audit history table for further use
create table AUD_HIST tablespace audit_ts as select * from AUD$;
-- truncate table sys.aud$;
Now you can move the audit tables from sysaux to the audit-tablespace:
--move AUD$
BEGIN
DBMS_AUDIT_MGMT.SET_AUDIT_TRAIL_LOCATION(
audit_trail_type => DBMS_AUDIT_MGMT.AUDIT_TRAIL_AUD_STD,
audit_trail_location_value => 'AUDIT_TS');
END;
/
--move FGA_LOG$
BEGIN
DBMS_AUDIT_MGMT.SET_AUDIT_TRAIL_LOCATION(
audit_trail_type => DBMS_AUDIT_MGMT.AUDIT_TRAIL_FGA_STD,
audit_trail_location_value => 'AUDIT_TS');
END;
/
--moving additional audit tables
alter table FGACOL$ move tablespace AUDIT_TS;
Short check of audit-parameters:
-- check audit parameters
col parameter_name for a30
col parameter_value for a20
col audit_trail for a20
show parameter audit
SELECT * FROM dba_audit_mgmt_config_params;
Before starting any cleanup you should be sure that no old jobs exist:
-- deinit all purge jobs
exec dbms_audit_mgmt.deinit_cleanup( dbms_audit_mgmt.audit_trail_all );
exec dbms_audit_mgmt.deinit_cleanup( dbms_audit_mgmt.audit_trail_os );
exec dbms_audit_mgmt.deinit_cleanup( dbms_audit_mgmt.audit_trail_xml );
exec dbms_audit_mgmt.deinit_cleanup( dbms_audit_mgmt.audit_trail_aud_std );
exec dbms_audit_mgmt.deinit_cleanup( dbms_audit_mgmt.audit_trail_fga_std )
Now you can set up an audit-management, e.g. every 24 hours, which purges audit-entries older than 7 months:
-- init cleanup for 24 hours
exec DBMS_AUDIT_MGMT.INIT_CLEANUP( DBMS_AUDIT_MGMT.AUDIT_TRAIL_all, 24 );
-- set retention (last_archive_timestamp, sysdate -210 days) =7 months
exec dbms_audit_mgmt.set_last_archive_timestamp( dbms_audit_mgmt.AUDIT_TRAIL_AUD_STD, to_timestamp(sysdate-210));
exec dbms_audit_mgmt.set_last_archive_timestamp( dbms_audit_mgmt.AUDIT_TRAIL_FGA_STD, to_timestamp(sysdate-210));
exec DBMS_AUDIT_MGMT.SET_LAST_ARCHIVE_TIMESTAMP( dbms_audit_mgmt.audit_trail_unified, sysdate-210);
-- 1 means RAC-node 1
exec dbms_audit_mgmt.set_last_archive_timestamp( dbms_audit_mgmt.AUDIT_TRAIL_OS, to_timestamp(sysdate-210), 1);
exec dbms_audit_mgmt.set_last_archive_timestamp( dbms_audit_mgmt.AUDIT_TRAIL_XML, to_timestamp(sysdate-210), 1);
Short check of parameter settings:
-- getting parameters
COLUMN parameter_name FORMAT A30
COLUMN parameter_value FORMAT A20
COLUMN audit_trail FORMAT A20
col days_back  for 9999  head "days|back"
select audit_trail, rac_instance, last_archive_ts, extract(day from(systimestamp-last_archive_ts))days_back from DBA_AUDIT_MGMT_LAST_ARCH_TS;
Now you can set up and initiate the purge-jobs:
-- creating purge job for all audit trails
BEGIN
dbms_audit_mgmt.create_purge_job(
audit_trail_type => dbms_audit_mgmt.audit_trail_all,
audit_trail_purge_interval => 24  /* hours */,
audit_trail_purge_name => 'DAILY_AUDIT_PURGE',
use_last_arch_timestamp => TRUE);
END;
/
-- create job for automatic updating last_archive_timestamp
create or replace procedure AUDIT_UPDATE_RETENTION( m_purge_retention  IN  number  DEFAULT 210
) AS
BEGIN
DBMS_AUDIT_MGMT.SET_LAST_ARCHIVE_TIMESTAMP( DBMS_AUDIT_MGMT.AUDIT_TRAIL_AUD_STD, TO_TIMESTAMP(SYSDATE-m_purge_retention));
DBMS_AUDIT_MGMT.SET_LAST_ARCHIVE_TIMESTAMP( DBMS_AUDIT_MGMT.AUDIT_TRAIL_AUD_STD, TO_TIMESTAMP(SYSDATE-m_purge_retention));
DBMS_AUDIT_MGMT.SET_LAST_ARCHIVE_TIMESTAMP( DBMS_AUDIT_MGMT.AUDIT_TRAIL_FGA_STD, TO_TIMESTAMP(SYSDATE-m_purge_retention));
DBMS_AUDIT_MGMT.SET_LAST_ARCHIVE_TIMESTAMP( DBMS_AUDIT_MGMT.AUDIT_TRAIL_UNIFIED, TO_TIMESTAMP(SYSDATE-m_purge_retention));
DBMS_AUDIT_MGMT.SET_LAST_ARCHIVE_TIMESTAMP( DBMS_AUDIT_MGMT.AUDIT_TRAIL_OS, TO_TIMESTAMP(SYSDATE-m_purge_retention), 1);
DBMS_AUDIT_MGMT.SET_LAST_ARCHIVE_TIMESTAMP( DBMS_AUDIT_MGMT.AUDIT_TRAIL_XML, TO_TIMESTAMP(SYSDATE-m_purge_retention), 1);
END;
/
You can test it now:
-- test run
exec audit_update_retention(210);
Before we invoke the new job, we get sure that no old bodies are left:
-- drop job if exists
set serveroutput on
begin
dbms_scheduler.drop_job(job_name => 'DAILY_AUDIT_UPDATE_RETENTION');
end;
/
-- create job for last_archive_timestamp
set serveroutput on
declare
m_purge_retention number DEFAULT 210;
ex_job_doesnt_exist EXCEPTION;
PRAGMA EXCEPTION_INIT(ex_job_doesnt_exist, -27475);
begin
--dbms_scheduler.drop_job(job_name => 'DAILY_AUDIT_UPDATE_RETENTION');
--dbms_output.put_line(chr(13)||'= 60;
DBMS_SCHEDULER.create_job (
job_name => 'DAILY_AUDIT_UPDATE_RETENTION',
job_type => 'PLSQL_BLOCK',
job_action => 'BEGIN
DBMS_AUDIT_MGMT.SET_LAST_ARCHIVE_TIMESTAMP( DBMS_AUDIT_MGMT.AUDIT_TRAIL_AUD_STD, TO_TIMESTAMP(SYSDATE-m_purge_retention));
DBMS_AUDIT_MGMT.SET_LAST_ARCHIVE_TIMESTAMP( DBMS_AUDIT_MGMT.AUDIT_TRAIL_AUD_STD, TO_TIMESTAMP(SYSDATE-m_purge_retention));
DBMS_AUDIT_MGMT.SET_LAST_ARCHIVE_TIMESTAMP( DBMS_AUDIT_MGMT.AUDIT_TRAIL_FGA_STD, TO_TIMESTAMP(SYSDATE-m_purge_retention));
DBMS_AUDIT_MGMT.SET_LAST_ARCHIVE_TIMESTAMP( DBMS_AUDIT_MGMT.AUDIT_TRAIL_UNIFIED, TO_TIMESTAMP(SYSDATE-m_purge_retention));
DBMS_AUDIT_MGMT.SET_LAST_ARCHIVE_TIMESTAMP( DBMS_AUDIT_MGMT.AUDIT_TRAIL_OS, TO_TIMESTAMP(SYSDATE-m_purge_retention), 1);
DBMS_AUDIT_MGMT.SET_LAST_ARCHIVE_TIMESTAMP( DBMS_AUDIT_MGMT.AUDIT_TRAIL_XML, TO_TIMESTAMP(SYSDATE-m_purge_retention), 1);
END;',
start_date => SYSTIMESTAMP,
repeat_interval => 'freq=daily; byhour=0; byminute=0; bysecond=0;',
end_date => NULL,
enabled => TRUE,
auto_drop => FALSE,
comments => 'every day, update last_archive_timestamp (which DAILY_AUDIT_PURGE uses) to '||m_purge_retention||' days back.'
);
--Exception
--when ex_must_be_declared then
--dbms_output.put_line('DAILY_AUDIT_UPDATE_RETENTION: component missing?'||chr(13));
END;
/
An other option would be to start the jon manually or to purge the audit-trail on demand:
-- manual start of purge jobs
select distinct job_name, owner from dba_scheduler_jobs;
exec dbms_scheduler.run_job('DAILY_AUDIT_UPDATE_RETENTION',use_current_session=>false);
exec dbms_scheduler.run_job('audsys.DAILY_AUDIT_PURGE',use_current_session=>false);
-- other options
exec DBMS_AUDIT_MGMT.FLUSH_UNIFIED_AUDIT_TRAIL;
-- or
begin
DBMS_AUDIT_MGMT.FLUSH_UNIFIED_AUDIT_TRAIL;
for i in 1..10 loop
DBMS_AUDIT_MGMT.TRANSFER_UNIFIED_AUDIT_RECORDS;
end loop;
end;
/
begin
DBMS_AUDIT_MGMT.CLEAN_AUDIT_TRAIL(
audit_trail_type => DBMS_AUDIT_MGMT.AUDIT_TRAIL_UNIFIED,
use_last_arch_timestamp => FALSE);
end;
/
https://support.oracle.com/knowledge/Oracle%20Database%20Products/2904294_1.html
https://docs.oracle.com/en/database/oracle/oracle-database/19/sqlrf/AUDIT-Unified-Auditing.html
https://oracle-base.com/articles/23/auditing-enhancements-23
L’article Cleanup Audit Trail – the Full Picture est apparu en premier sur dbi Blog.
Oracle 23ai New Backup & Recovery Features
In this article I will give a short overview of some Backup & Recovery features in the new Oracle 23ai database. Meanwhile there are more than 300 new features in Oracle 23ai most of them reflecting artificial intelligence. I will focus here on pure Backup & Recovery enhancements.
Creating Immutable Backups Using RMANIt is now possible to store immutable backups with the Oracle Database Cloud Backup Module for Oracle Cloud Infrastructure (OCI) which enables to configure backups suchlike, that they cannot be altered or deleted for a specific period, which helps to follow any compliance and data protection rules. Immutable backups will prevent anyone, even administrators to delete or modify backups in OCI Object Storage.
Here’s a step-by-step example to set up immutable backups using RMAN and the Oracle Database Cloud Backup Module for OCI:
You have to download and install the Oracle Database Cloud Backup Module on your database server whith following options: You can specify the -bucket parameter (and the name of an existing bucket or a new immutable bucket that you have created in OCI) otherwise the default bucket created by the installer will be used.
java -jar oci_install.jar -host https://objectstorage.<region>.oraclecloud.com -pdb1 <password> -opcId "<tenancy-namespace>/<bucket-name>" -opcPassFile <path-to-opc-pass-file> -libDir <path-to-lib-dir>In RMAN you have to configure your SBT channel that way, that it will use the Oracle Database Cloud Backup Module. Now you can create a backup, e.g immutable for 30 days:
- KEEP UNTIL TIME ‘SYSDATE+30’: specifies that the backup is retained and immutable for 30 days.
- IMMUTABLE: marks the backup as immutable.
A backup-script (like following example) can be used:
RMAN> connect target /
RMAN> CONFIGURE CHANNEL DEVICE TYPE sbt PARMS 'SBT_LIBRARY=/opt/oracle/lib/libopc.so, SBT_PARMS=(OPC_PFILE=/opt/oracle/opc/ocipassfile)';
BACKUP AS BACKUPSET DATABASE KEEP UNTIL TIME 'SYSDATE+30' IMMUTABLE;
RMAN> LIST BACKUP OF DATABASE SUMMARY;
You should ensure,that the backup status is AVAILABLE und and the backupset includes the KEEP UNTIL date.
That OCI backups work appropiatley you have to take into consideration, that
- OCI Object Storage bucket has Object Lock enabled to support immutability.
- The IMMUTABLE keyword is used for specifying that the backup should not be altered or deleted within the specified retention.
- OCI Object Storage policy and IAM settings must allow creating immutable objects.
From Oracle 23ai on RMAN encrypted backups default to AES256 encryption algorithm.
For backward compatibility existing backups created with previous encryption settings remain accessible. However, new backups will use AES256 unless explicitly configured otherwise. In other words, restore is supported by using existing backupsets AES128 or AES192 encryption algorithms and by changing your default settings you can still create backups with AES128 encryption.
With AES256 encryption you will get enhanced security using a stronger encryption standard and achieving industry standards and compliance regulations for sensitive data.
The default encryption using AES256 can be easily invoked out-of-the-box:
RMAN> SET ENCRYPTION ON IDENTIFIED BY 'your_password';
RMAN> BACKUP DATABASE;Additionally Oracle 23c AI Database includes several enhancements to globally distributed database coordinated backup and restore operations, aiming to improve efficiency, consistency, and reliability in multi-datacenter environments. Here are some key enhancements:
Unified Backup Management can simplify the management of backups across globally distributed databases by providing a centralized framework to coordinate backup operations. This ensures that backups are synchronized and consistent across all sites. It can be programmed via DBMS_BACKUP_RESTORE:
-- Example SQL script to configure unified backup policy
-- Define global backup policy
BEGIN
DBMS_BACKUP_RESTORE.SET_GLOBAL_POLICY(
policy_name => 'GlobalBackupPolicy',
backup_schedule => 'FULL EVERY SUNDAY 2:00 AM UTC, INCREMENTAL DAILY 2:00 AM UTC',
retention_period => 30,
encryption_algorithm => 'AES256'
);
END;
/
-- Apply global backup policy to all distributed databases
BEGIN
DBMS_BACKUP_RESTORE.APPLY_GLOBAL_POLICY(
policy_name => 'GlobalBackupPolicy',
target_databases => 'NYC_DB, LDN_DB, TOKYO_DB'
);
END;
/
Global Backup Policies: You can now define global backup policies that apply uniformly across all distributed databases. This standardization helps in maintaining consistency and compliance with organizational policies. It can be set up like:
BEGIN
DBMS_BACKUP_RESTORE.CONFIGURE_GLOBAL_SETTING(
setting_name => 'RETENTION_POLICY',
setting_value => 'RECOVERY WINDOW OF 30 DAYS'
 );
DBMS_BACKUP_RESTORE.CONFIGURE_GLOBAL_SETTING(
setting_name => 'BACKUP_OPTIMIZATION',
setting_value => 'ON'
);
DBMS_BACKUP_RESTORE.CONFIGURE_GLOBAL_SETTING(
setting_name => 'ENCRYPTION_ALGORITHM',
setting_value => 'AES256'
);
DBMS_BACKUP_RESTORE.CONFIGURE_GLOBAL_SETTING(
setting_name => 'ENCRYPTION_PASSWORD',
setting_value => 'your_encryption_password'
 );
END;
/
Consistent Point-in-Time Recovery ensures that all databases in a distributed environment can be restored to the same point in time, maintaining data consistency across different geographic locations (in my opinion not really new, it is managed via known RMAN-scripts for restore & recover).
Cross-Site Transaction Coordination enhances the coordination of transactions across distributed databases to ensure that backup and restore operations capture a consistent state of the entire database system, it can be done via Oracle Global Data Services (GDS):
-- Connect to the GDS catalog database
sqlplus / as sysdba

-- Create the GDS catalog
BEGIN
  DBMS_GDS.CREATE_GDS_CATALOG();
END;
/

-- Add databases to the GDS pool
BEGIN
  DBMS_GDS.ADD_GDS_DATABASE(
    db_unique_name => 'NYC_DB',
    connect_string => 'NYC_DB_CONN_STRING',
    region         => 'AMERICAS'
  );

  DBMS_GDS.ADD_GDS_DATABASE(
    db_unique_name => 'LDN_DB',
    connect_string => 'LDN_DB_CONN_STRING',
    region         => 'EMEA'
  );

  DBMS_GDS.ADD_GDS_DATABASE(
    db_unique_name => 'TOKYO_DB',
    connect_string => 'TOKYO_DB_CONN_STRING',
    region         => 'APAC'
  );
END;
/
-- On each database (NYC_DB, LDN_DB, TOKYO_DB)
sqlplus / as sysdba

-- Enable distributed transactions
ALTER SYSTEM SET distributed_transactions = 10 SCOPE = BOTH;

-- Configure the global_names parameter
ALTER SYSTEM SET global_names = TRUE SCOPE = BOTH;

-- Set the commit point strength
ALTER SYSTEM SET commit_point_strength = <value> SCOPE = BOTH;

-- Configure Oracle Net for distributed transactions (update tnsnames.ora and listener.ora as necessary)
-- Create database links to enable cross-site communication
-- Begin the distributed transaction
SET TRANSACTION READ WRITE;

...

-- Commit the transaction
COMMIT;
Parallel Backup Streams support parallel backup streams to expedite the backup process, making it faster and more efficient, especially for large databases spread across multiple sites. You just have to configure RMAn-channels like in previous releases but in Oracle 23ai Adaptive Parallelism is used. By setting a higher level of parallelism (e.g., 8), Oracle 23ai can dynamically adjust the number of active channels based on real-time system performance and workload, rather than strictly adhering to the configured number.
Automated Restore Coordination automates the coordination of restore operations across multiple databases, ensuring that all parts of the distributed database are restored in a synchronized manner, it will be invoked with:
-- Enable automated restore coordination
CONFIGURE RESTORE COORDINATION ON;
-- Automated restore coordination across distributed databases
RESTORE DATABASE FROM SERVICE 'NYC_DB' USING CHANNEL c1;
RESTORE DATABASE FROM SERVICE 'LDN_DB' USING CHANNEL c2;
RESTORE DATABASE FROM SERVICE 'TOKYO_DB' USING CHANNEL c3;
-- Recover database
RECOVER DATABASE;
Resilient Backup Infrastructure enhancements to the backup infrastructure to handle network disruptions and other issues that may arise in a globally distributed environment, ensuring that backups are resilient and reliable. Oracle Database 23ai enhances the resilience of backup infrastructure by integrating features like Data Guard for high availability, Fast Recovery Area for automated backup management, and RMAN duplication for redundant data copies.
RMAN Operational EnhancementsAutomatic Block Repair During Backup: Oracle 23ai enhances RMAN’s capability to automatically detect and repair corrupt blocks during backup operations.
RMAN> BACKUP DATABASE PLUS ARCHIVELOG CHECK READONLY;Improved Block Corruption Detection: Oracle 23ai has enhanced algorithms for faster and more accurate detection of block corruption during backup and restore operations and the some structures are used for Enhanced Backup Validation: RMAN has now faster and more efficient methods to validate backups and ensure data integrity.
Simplified Database Migration Across Platforms Using RMANOracle Database 23ai includes RMAN-enhancements which simplify the process of migrating databases across different platforms. This feature is particularly useful when transitioning databases between heterogeneous environments, ensuring minimal downtime and efficient migration. New command options allow existing RMAN backups to be used to transport tablespaces or pluggable databases to a new destination database with minimal downtime. With the example below you can easily migrate from e.g. Linux to Windows or vice versa:
-- Connect RMAN to both source and target databases
CONNECT TARGET sys@PROD_DB
CONNECT AUXILIARY sys@TARGET_DB

-- Configure cross-platform migration settings
SET NEWNAME FOR DATABASE TO '/path/to/new/PROD_DB';

-- Start migration process
DUPLICATE TARGET DATABASE TO TARGET_DB
  FROM ACTIVE DATABASE
  SPFILE
  PARAMETER_VALUE_CONVERT 'db_unique_name=PROD_DB','db_unique_name=TARGET_DB'
  SET db_file_name_convert='/prod_data/','/target_data/'
  SET log_file_name_convert='/prod_redo/','/target_redo/';
-- Check the migration progress
SHOW DUPLICATE SUMMARY;
-- Validate the migrated database
VALIDATE DATABASE;L’article Oracle 23ai New Backup & Recovery Features est apparu en premier sur dbi Blog.
The SUSECON 2024 in Berlin
As part of the SUSE partner program, we were warmly invited to attend the SUSECON 24 in Berlin with my colleague Jean-Philippe Clapot. A two and half days event where we joined the SUSE family to learn more about their strategy and vision. “SUSE Make Choice Happens” with their Open Source Solutions extended with the PRIME support and advance offering. This conference in Berlin was clearly the place to hear about the latest announcements, directly from SUSE. The round table featured discussions on trendy topics such as SUSE’s “partner first” strategy, Linux, the Cloud Native, the Edge and the Generative AI.


I would like to thank Nico Lamberti in particular for the great collaboration we’ve had over the last few months. With his help, we have succeeded in strengthening synergies between SUSE and dbi services in terms of technical know-how and sponsorship. The success of our Rancher & NeuVector technical webinar and community events hosted by dbi and powered by Sequotech, such as the Data Community Conference perfectly illustrate our partnership with SUSE. That’s just a few examples, there’s many more joint events to come …
For my first participation at SUSECON, the objective was not only to participate in the technical sessions, follow the keynotes for new announcements or visit the technology presentation booths to discover SUSE products and sponsor demonstrations…. but also to reinforce our partnership, meet new people and freely share ideas on Linux, Cloud Native, Edge and AI.
Through this blog post, I’ll try to summarize what I discovered and what I learned!
I hope you’ll enjoy reading it.
The keynotes announcements.
The recent acquisition of StackState by SUSE was presented to the audience, who applauded warmly the arrival of this Ultimate Cloud Native offering in SUSE portfolio. StackState provides end-to-end observability capabilities, impressively expanding the SUSE Ecosystem. The key consideration around StackState is that it stretches out observability to include database, endpoints, message queues, and more – not just the Kubernetes setup.
From the Linux distributions, to managing and handling container workloads with Rancher, to Zero-trust security tools adding attack detection and protection with NeuVector, to Harvester that handles VM workloads along with containers, StackState covers it all ! Its observability capabilities are purely impressive.
This StackState platform will most probably be integrated into Rancher Prime at first, and we truly hope that it will also be available as an Open Source solution later on.
Liberty Linux and SUSE AI were also presented during the Keynotes.
SUSE provides a complete ecosystem for running VM and containers workload in the Cloud or On-Prem as Open Source with the possibility to get extended support and capability through the PRIME offering !
The Keynote was focusing on the following 4 main axes:
- Linux
- Cloud Native
- Edge
- AI


During the last day of the keynote, we got an overview of the latest innovations on SUSE Linux : a new Linux kernel is being introduced.
Additionally, SUSE will extend its Linux support, thus becoming the vendor to propose the longest support period in the industry.
Harvester was also in front of the announcement : It does not intent to become a replacement of VMWare but an alternative for those who already did the choice to modernise their Platform, bridging Virtualisation and Cloud Native (Running VM along with containers workload is where Harvester is coming into the picture).
Few figures have been presented to us, SUSE ecosystem is impressive and it will continue to grow :
- SUSE’s 30 years of Open-Source Solution counts more than 50’000 active Rancher users
- more than 10 millions downloads of K3s monthly,
- 68% of Harvester YoY growth and download growth
- more than 125’000 Longhorn managed nodes
Latest updates and information about the Kubernetes Landscape and Rancher Prime 3.1 update :
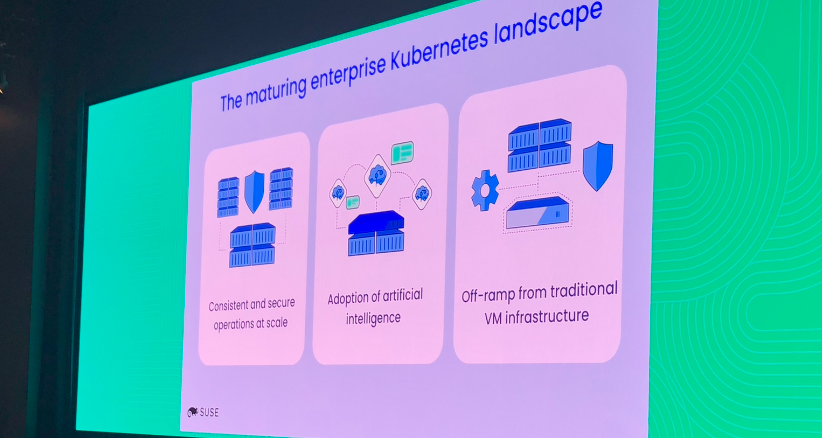
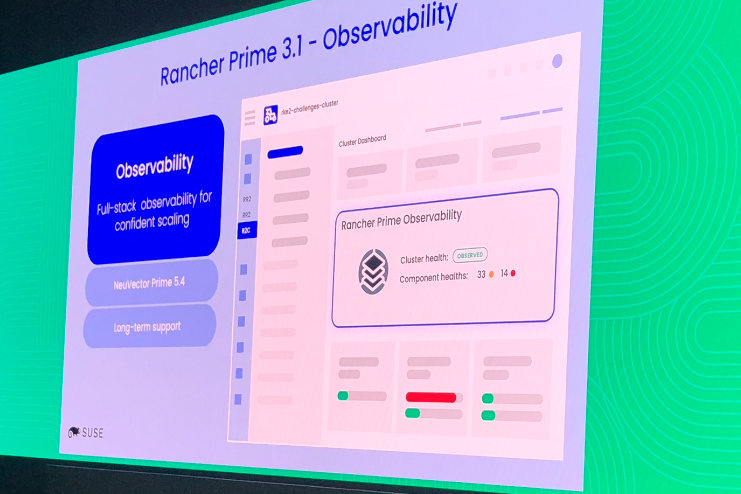
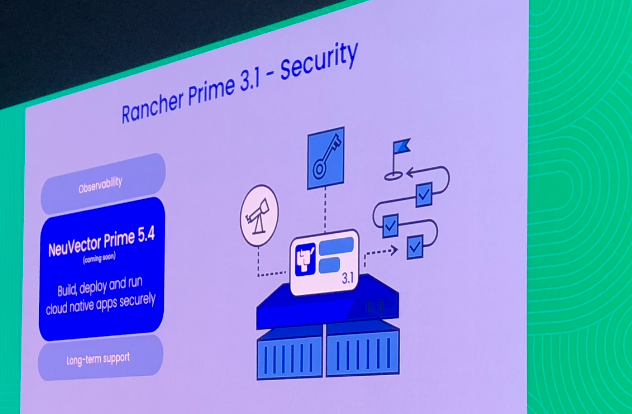
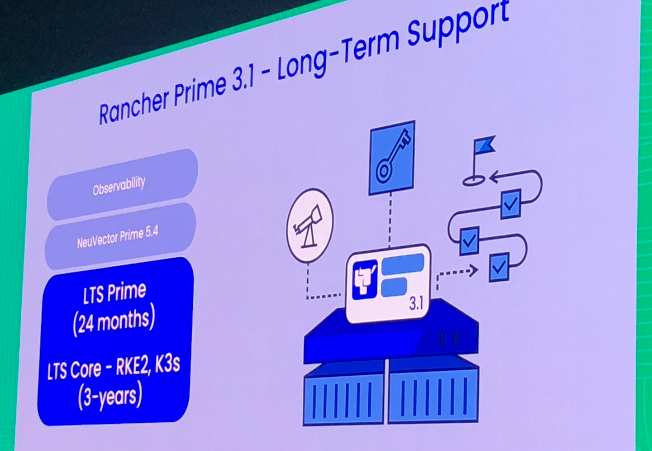
Summary of the most interesting technical sessions I followed
The DEMOPALOOZA.
During the last session we followed before leaving, we could participate into a fun presentation on SUMA, Rancher, AI, Harvester, etc
It was presented in a playful way, with role play simulating crash and restoration of linux state, presenting capabilities of the SUSE AI solution and so on.
Really interesting way to conclude the SUSECON with a touch of humor.

Multi-tier management and observability of Edge clusters with Rancher
Edge clusters
During this session, the edge computing was explained and shoewed that the next challenge will be to manage very large scale infrastructures and observe more and more clusters, not only hundreds but it will soon become tenth of thousands of clusters.
The limits are pushed beyond what a single Rancher manager can currently handle. High quality and user experience must be kept in mind for maintaining clusters at large scale, focused on observability. For that purpose, Hub Rancher Cluster is a new feature that will allow to manage a set of spoke clusters where multiple downstream clusters will be attached. The Hub Rancher will receive aggregated information from each Spoke’s Downstream clusters and Grafana dashboard will allow to display overall information about the health of downstream clusters. A “drill down” capability is implemented to have a detailed overview of the whole edge platform of a company. Grafana Mimir is used to store all this data and present them in a consolidated dashboard view.
This feature is not yet available. It should be rolled out soon!
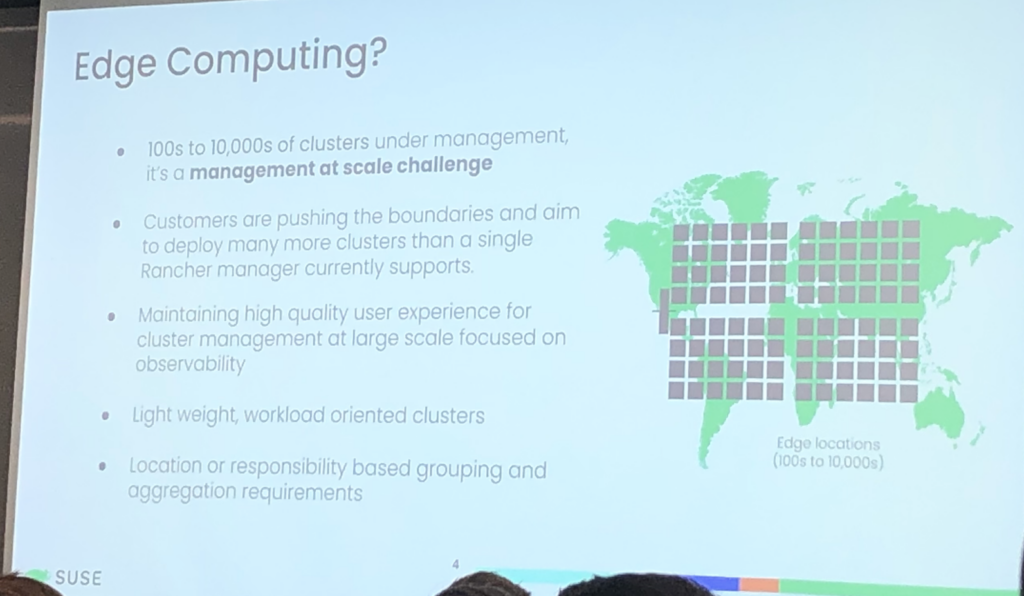
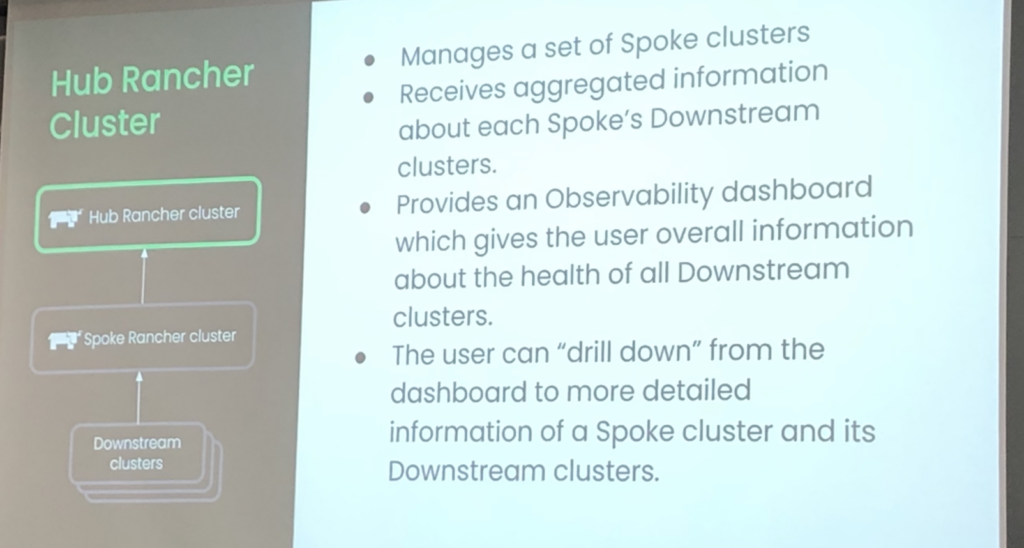
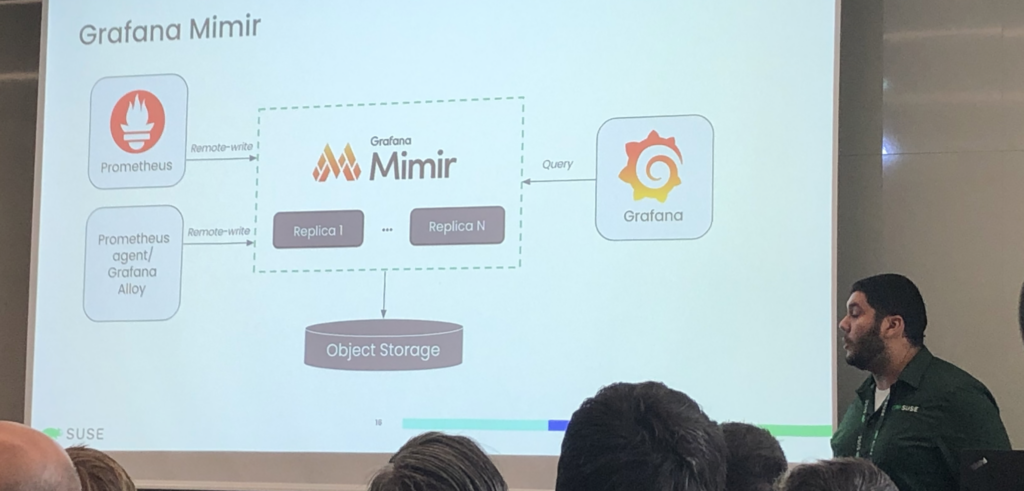
Cloud-Native Software Virtual Machines

I really liked this session as it was about Software Virtual Machine such as the JVM, the eBPF program and WebAssembly. The speaker explained what’s really behind this concept, its origins, and describing eBPF, WebAssembly and Edge applications at a high level. This really shows the evolution of the Software Virtual Machine since the beginning till today, showing that eBPF and WebAssembly will be the perfect match.
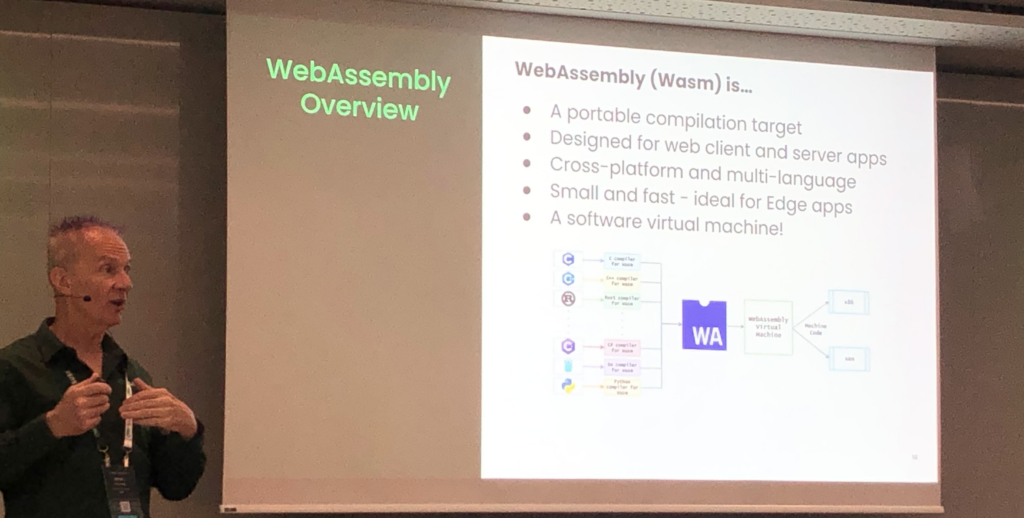
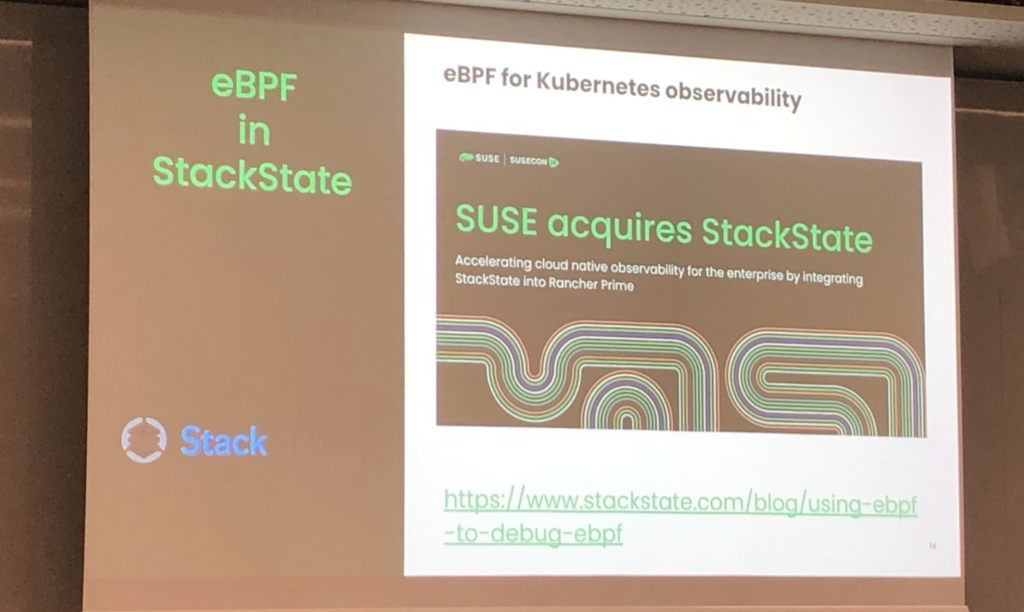
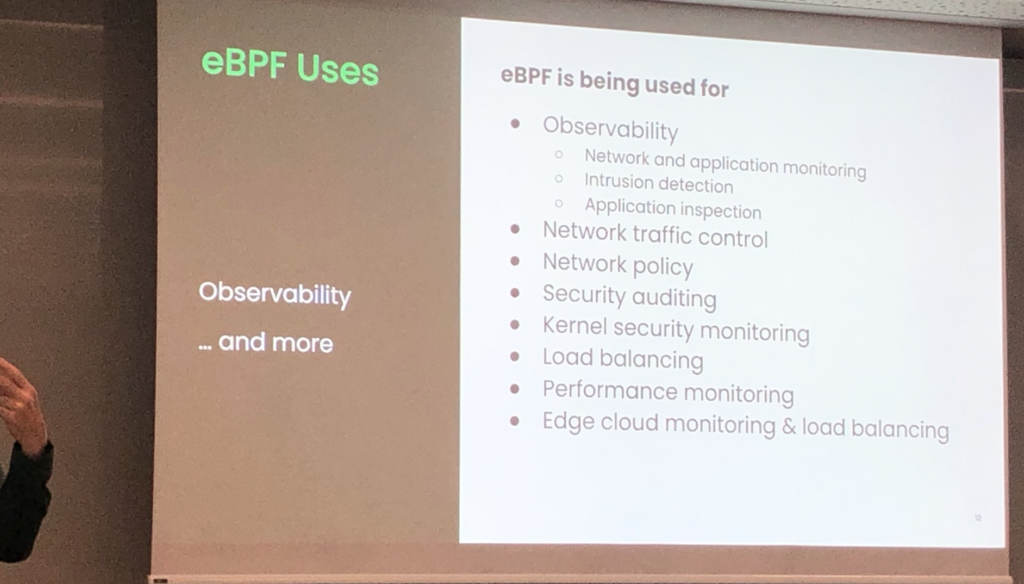
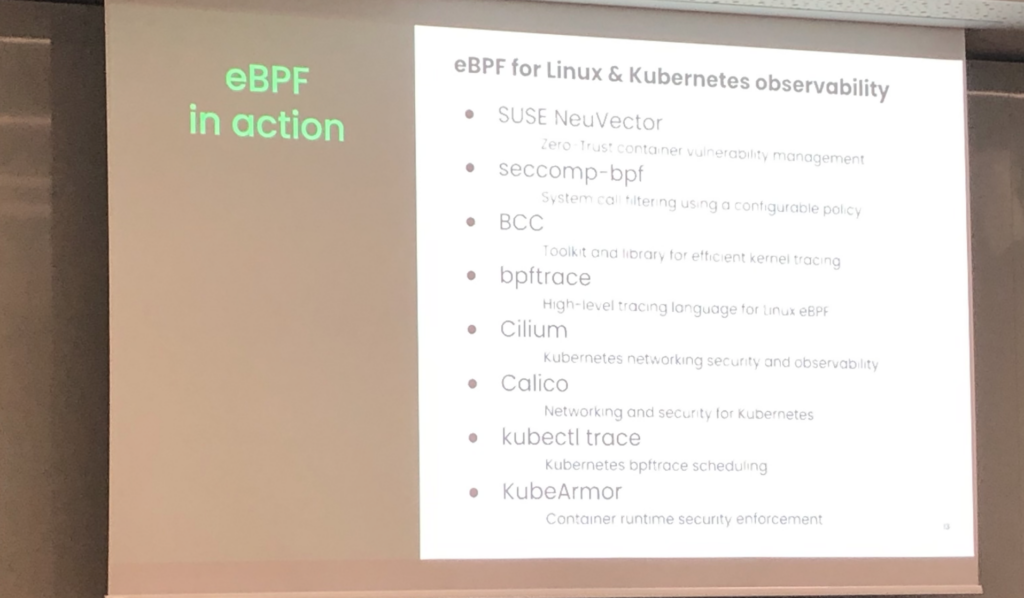
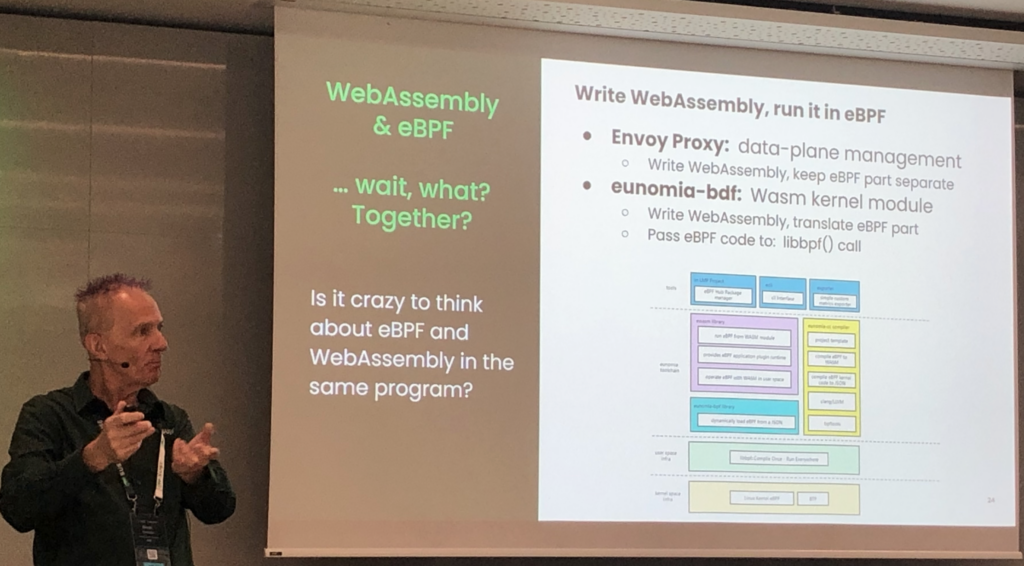
Deep Dive into the SUSE Customer Centre, RMT and SUSE Registry
The last technical session I followed was about the value of subscribing to SUSE, the key take aways were the following:
- Trusted open-source supply chain
- Linux, infrastructure and container management
- Maintenance and security updates
- Documentation & knowledge base
- Technical support
The trusted official SUSE container image provides several benefits:
- Easy discovery
- Rich information
- Vulnerability reports
- Image documentation
- Search and filtering
- Access exclusive subscriber-only content
A self-hosted, supported container image and OCI artifact repository can also be deployed On-Prem without external access requirements when pulling image from a Kubernetes cluster.
The benefits of this private registry are:
- Designed to work with the entire SUSE portfolio
- Host official SUSE images and helm charts, as well as your own
- Role-based access control
- Vulnerability scans
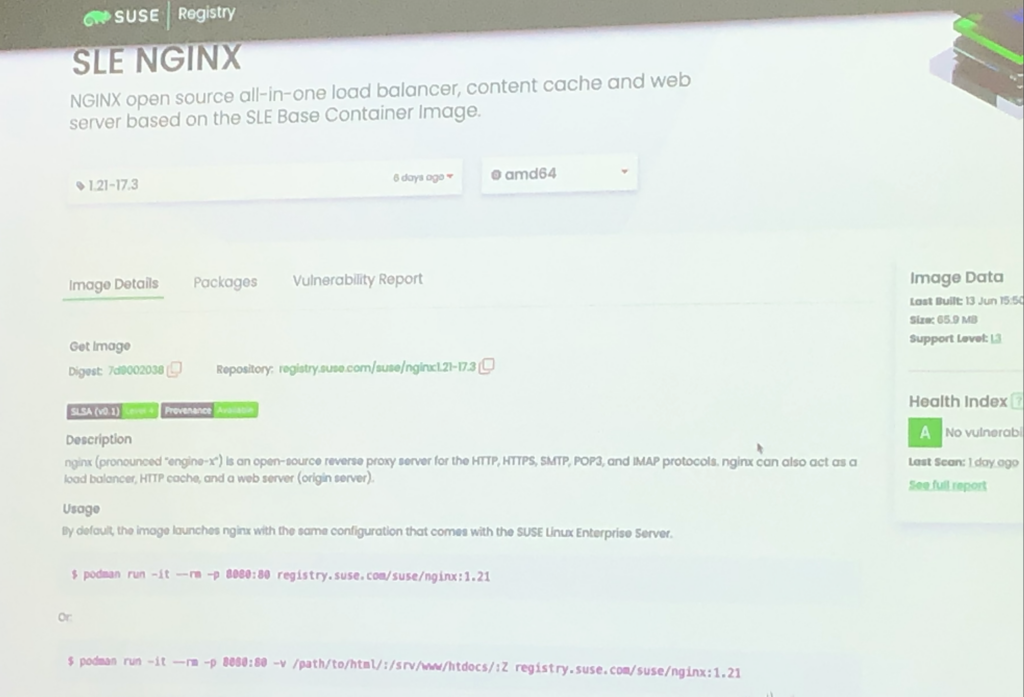
Thanks to the organiser of the event as well as the SUSE employees. I had the chance to discuss with some of them outside, during the party or when taking break between the sessions !
L’article The SUSECON 2024 in Berlin est apparu en premier sur dbi Blog.
Using local images with nerdctl build?
Following the issue I talked about in my last blog, I started building local images using “nerdctl” for OpenText Documentum 23.4. That worked properly for the first one, which was using the Red Hat base, to install some common OS packages used by for components/containers of Documentum. However, when I tried to do the next one, based on it, to start installing an Oracle Client specifically for the Documentum Content Server container, it failed with this error:
Mac:ora-client$ ./build.sh
************************************************
*** Building the image 'ora-client:19.3.0.0' ***
************************************************

[+] Building 2.2s (3/3) FINISHED
 => [internal] load build definition from Dockerfile                                                             0.1s
 => => transferring dockerfile: 1.42kB                                                                           0.0s
 => [internal] load .dockerignore                                                                                0.1s
 => => transferring context: 2B                                                                                  0.0s
 => ERROR [internal] load metadata for registry-sbx.it.dbi-services.com/dbi_dctm/linux-ot:8.10-901               2.1s
------
 > [internal] load metadata for registry-sbx.it.dbi-services.com/dbi_dctm/linux-ot:8.10-901:
------
Dockerfile:12
--------------------
  10 |
  11 |     ARG ARG_BASE_IMAGE
  12 | >>> FROM $ARG_BASE_IMAGE
  13 |
  14 |     LABEL maintainer="dbi ECM & Application Integration <dbi_eai@dbi-services.com>"
--------------------
error: failed to solve: registry-sbx.it.dbi-services.com/dbi_dctm/linux-ot:8.10-901: failed to do request: Head "https://registry-sbx.it.dbi-services.com/v2/dbi_dctm/linux-ot/manifests/8.10-901": x509: certificate is valid for ingress.local, not registry-sbx.it.dbi-services.com
FATA[0002] no image was built
Error: exit status 1

FATA[0000] failed to create a tmp single-platform image "registry-sbx.it.dbi-services.com/dbi_dctm/ora-client:19.3.0.0-tmp-reduced-platform": image "registry-sbx.it.dbi-services.com/dbi_dctm/ora-client:19.3.0.0": not found
Error: exit status 1

***********************************************************
*** Script completed for 'dbi_dctm/ora-client:19.3.0.0' ***
***********************************************************
Mac:ora-client$
The above “nerdctl build” command fails on the “FROM $ARG_BASE_IMAGE” where the base image is obviously the one I just built a few minutes before. The error is the same as for the previous blog, related to the Self-Signed SSL Certificate of the private registry. Maybe adding the “insecure-registry” parameter to the “nerdctl build” command could help workaround the security checks (Note: I tested for the sake of completeness, but it’s not possible). However, I didn’t do that in my previous blog as for me, it should only be required if you really/absolutely need to talk to the private registry… Since I just built the base image locally, why the hell would it need to be re-downloaded? That doesn’t make a lot of sense…
Just to confirm, I checked the local images, to make sure it’s tagged properly and available:
Mac:ora-client$ nerdctl images
REPOSITORY                                            TAG         IMAGE ID        CREATED          PLATFORM       SIZE       BLOB SIZE
registry-sbx.it.dbi-services.com/dbi_dctm/linux-ot    8.10-901    9b9b6662b7a7    9 minutes ago    linux/amd64    1.2 GiB    347.6 MiB
Mac:ora-client$
So, it is indeed there. I looked at Google again and found several people saying that “nerdctl” isn’t able to use local images at all… However, I also saw some people talking about a “buildkit” namespace and I remembered seeing the namespace being “default” on my system information:
Mac:ora-client$ nerdctl system info
Client:
 Namespace:	default
 Debug Mode:	false

Server:
 ...
Mac:ora-client$
Mac:ora-client$ nerdctl version
Client:
 Version:	v1.7.3
 OS/Arch:	linux/amd64
 Git commit:	0a464409d0178e16d3d2bed36222937ec3fc9c77
 buildctl:
  Version:	v0.12.5
  GitCommit:	bac3f2b673f3f9d33e79046008e7a38e856b3dc6

Server:
 containerd:
  Version:	v1.7.10
  GitCommit:	4e1fe7492b9df85914c389d1f15a3ceedbb280ac
 runc:
  Version:	1.1.10
  GitCommit:	18a0cb0f32bcac2ecc9a10f327d282759c144dab
Mac:ora-client$
Therefore, I thought I could try to list the images while specifying all namespaces to see what the outcome would be. Since I had no idea about which namespaces were present, I looked at the help of “nerdctl” and saw only “moby”, “k8s.io” and “default”. No mention of “buildkit” but I still tried it anyway to see if it would throw an error:
Mac:ora-client$ nerdctl --help | grep -i namespace
  namespace  Manage containerd namespaces
  -n, --n string                 Alias of --namespace (default "default")
      --namespace string         containerd namespace, such as "moby" for Docker, "k8s.io" for Kubernetes [$CONTAINERD_NAMESPACE] (default "default")
Mac:ora-client$
Mac:ora-client$ nerdctl --namespace moby image ls
REPOSITORY    TAG    IMAGE ID    CREATED    PLATFORM    SIZE    BLOB SIZE
Mac:ora-client$
Mac:ora-client$ nerdctl --namespace k8s.io image ls
REPOSITORY    TAG    IMAGE ID    CREATED    PLATFORM    SIZE    BLOB SIZE
Mac:ora-client$
Mac:ora-client$ nerdctl --namespace default images
REPOSITORY                                            TAG         IMAGE ID        CREATED           PLATFORM       SIZE       BLOB SIZE
registry-sbx.it.dbi-services.com/dbi_dctm/linux-ot    8.10-901    9b9b6662b7a7    18 minutes ago    linux/amd64    1.2 GiB    347.6 MiB
Mac:ora-client$
Mac:ora-client$ nerdctl --namespace buildkit image ls
REPOSITORY    TAG    IMAGE ID    CREATED    PLATFORM    SIZE    BLOB SIZE
Mac:ora-client$
What I got from that output is that the image is currently only visible on the default namespace, I assume because I didn’t specify any in the build command. What would happen if I put that image into the “buildkit” namespace instead? I saw on the Rancher Desktop documentation that it is possible to move an image to another environment or container engine, so I tried to execute that between namespaces:
Mac:ora-client$ nerdctl --namespace default save -o image.tar registry-sbx.it.dbi-services.com/dbi_dctm/linux-ot:8.10-901
Mac:ora-client$
Mac:ora-client$ nerdctl --namespace buildkit image ls
REPOSITORY    TAG    IMAGE ID    CREATED    PLATFORM    SIZE    BLOB SIZE
Mac:ora-client$
Mac:ora-client$ nerdctl --namespace buildkit load -i image.tar
unpacking registry-sbx.it.dbi-services.com/dbi_dctm/linux-ot:8.10-901 (sha256:9b9b6662b7a790c39882f8b4fd22e2b85bd4c419b6f6ffd350e447c35b2650f7)...
Loaded image: registry-sbx.it.dbi-services.com/dbi_dctm/linux-ot:8.10-901
Mac:ora-client$
Mac:ora-client$ nerdctl --namespace buildkit image ls
REPOSITORY                                            TAG         IMAGE ID        CREATED           PLATFORM       SIZE       BLOB SIZE
registry-sbx.it.dbi-services.com/dbi_dctm/linux-ot    8.10-901    9b9b6662b7a7    21 seconds ago    linux/amd64    1.2 GiB    347.6 MiB
Mac:ora-client$
Mac:ora-client$ rm image.tar
Mac:ora-client$
Now that the image is showing up on the “buildkit” namespace, would the build work? I simply re-executed the exact same command as before and this time it was successful:
[+] Building 149.2s (8/8) FINISHED
 => [internal] load build definition from Dockerfile                                                             0.1s
 => => transferring dockerfile: 1.42kB                                                                           0.0s
 => [internal] load .dockerignore                                                                                0.1s
 => => transferring context: 2B                                                                                  0.0s
 => [internal] load metadata for registry-sbx.it.dbi-services.com/dbi_dctm/linux-ot:8.10-901                     4.2s
 => [internal] load build context                                                                                0.4s
 => => transferring context: 21.51kB                                                                             0.4s
 => [1/3] FROM registry-sbx.it.dbi-services.com/dbi_dctm/linux-ot:8.10-901@sha256:9b9b6662b7a790c39882f8b4fd2    4.2s
 => => resolve registry-sbx.it.dbi-services.com/dbi_dctm/linux-ot:8.10-901@sha256:9b9b6662b7a790c39882f8b4fd2    4.2s
...
 => => exporting layers                                                                                          0.3s
 => => exporting manifest sha256:d6fc394f3c144735900f521d3dc603ef1b890e3460d4b94d226f9395de7ad1f3                0.1s
 => => exporting config sha256:67a60b84eacc425311471cd18fb538419e71cb1e1f4245fa21ad2215b93939f4                  0.0s
 => => sending tarball                                                                                          28.5s
However, the newly created image showed up on the “default” namespace. Therefore, I proceeded to add the command line parameter “–namespace buildkit” to both my “nerdctl build” and “nerdctl push” commands, so that it would create the images into the “buildkit” namespace and use these images to push them into the private registry. That way, it can use the local images and not download anything. Therefore, the updated and final commands for this second image build looks like this:
nerdctl --namespace buildkit build --no-cache --rm \
  --tag="${REGISTRY}/${OWNER}/${NAME}" \
  --build-arg ARG_BASE_IMAGE="${REGISTRY}/${OWNER}/${BASE_IMAGE}" \
  --build-arg ARG_ARTIFACTORY_URL="${ARTIFACTORY_URL}" \
  --build-arg ARG_ORACLE_VERSION="${ORACLE_VERSION}" \
  --build-arg ARG_ORACLE_VERSION_DIR="${ORACLE_VERSION_DIR}" \
  --build-arg ARG_ORACLE_PACKAGE_1="${ORACLE_PACKAGE_1}" \
  --build-arg ARG_ORACLE_PACKAGE_2="${ORACLE_PACKAGE_2}" \
  --build-arg ARG_ORACLE_BASE="${ORACLE_BASE}" \
  --build-arg ARG_APP_OWNER="${APP_OWNER}" \
  --build-arg ARG_DATA_BASE="${DATA_BASE}" .
echo
nerdctl --namespace buildkit push --insecure-registry ${REGISTRY}/${OWNER}/${NAME}
Just to make sure everything worked, I removed all local images and re-built the 1st and 2nd images from scratch. It behaved as expected, putting new images into the “buildkit” namespace and using them properly, without pulling anything from the private registry.
In conclusion, is it possible to make “nerdctl” use local images? I would say yes… But you have to specifically build your images into the “buildkit” namespace and not into the “default” one, otherwise it will not work. Why? No idea :D… As an additional note, this worked on my Mac using Rancher Desktop (with both old (1.9) and recent versions (1.13)) but when I tried it on a standard Linux VM without Rancher Desktop (just pure containerd/nerdctl), it didn’t work and was still trying to pull images from the registry, no matter what. Therefore, on the Linux VM, I switched to “podman” (yet another one… :D).
L’article Using local images with nerdctl build? est apparu en premier sur dbi Blog.
Push images to a Self-Signed Cert registry with Rancher Desktop
I recently had to work on creating some custom images for OpenText Documentum 23.4 that will run on Kubernetes but I faced some trouble while trying to push images with “dockerd” and “nerdctl”. Before I start talking about that, I clearly don’t consider myself as a Docker expert, of course I worked with it a bit in the past years but that’s pretty much it. Regarding my setup, I’m on Mac, I have Rancher Desktop on it, and I use that for its embedded container engine, which is (and was for me) “dockerd” (mobyd) by default.
OpenText provide images for their Documentum software since a few years already (2019?) but at the beginning it wasn’t very usable (difficult to customize, lack of security controls, missing components, etc.). Therefore, for a few customers, we developed our own containers that are using the silent installations of Documentum and that worked pretty well, since there are ~80/100 Documentum environments at customers running and using our images. If you want to know more about the silent installation, I wrote a series of blogs back in 2018, it’s pretty old but still quite accurate. Despite the evolutions and improvements of OpenText Documentum images over the year, I still think there are a few pain points. Therefore, my goal here was to check/adapt our images for the recent version Documentum 23.4. A colleague from our DevOps team setup an internal Kubernetes environment with a private registry for me to start working on the build of the images.
For quick development/testing, I created a small shell script that simply trigger a build and a push of the image to the registry. The first image I needed to create is a base OS image that includes all the OS packages required to install and run a Documentum environment (common base image with some packages used by all containers of all Documentum components). I used Red Hat as the underlying OS as this is the one used mainly at our customers for support and compatibility reasons. The shell script is rather simple:
#!/bin/bash

# Build Arguments
export NAME="linux-ot:8.10-901"
export OWNER="dbi_dctm"
export REGISTRY="registry-sbx.it.dbi-services.com"
export BASE_IMAGE="registry.access.redhat.com/ubi8:8.10-901.1716482497"
export ENV="DEV"

# Build the image
echo "**********************************************"
echo "*** Building the image '${NAME}' ***"
echo "**********************************************"
echo
docker build --no-cache --rm=true --force-rm=true --squash \
  --tag="${REGISTRY}/${OWNER}/${NAME}" \
  --build-arg ARG_BASE_IMAGE="${BASE_IMAGE}" \
  --build-arg ARG_ENV="${ENV}" .
echo
docker push ${REGISTRY}/${OWNER}/${NAME}
echo
echo "*********************************************************"
echo "*** Script completed for '${OWNER}/${NAME}' ***"
echo "*********************************************************"
The build part was a success but unfortunately for me, the push failed due to the Private Registry being setup on port 443 with a Self-Signed SSL Certificate… Therefore, I started looking all over google for ways to configure Docker properly to allow that but without much success. I found a few resources such as this one from Rancher directly, that is supposed to trust the Self-Signed SSL Certificate or this one to allow some registries or a few other ones that would suggest to add “insecure-registries” to the Docker configuration. I tried them all but none were sufficient. First of all, I tried to trust the Self-Signed SSL Certificate as indicated in the Rancher documentation:
Mac:linux-ot$ DOMAIN=registry-sbx.it.dbi-services.com
Mac:linux-ot$ PORT=443
Mac:linux-ot$
Mac:linux-ot$ cat /etc/default/docker
DOCKER_OPTS="$DOCKER_OPTS --insecure-registry=registry-sbx.it.dbi-services.com"
Mac:linux-ot$
Mac:linux-ot$ openssl s_client -showcerts -connect ${DOMAIN}:${PORT} < /dev/null 2> /dev/null | openssl x509 -outform PEM > ca.crt
Mac:linux-ot$
Mac:linux-ot$ sudo mkdir -p /etc/docker/certs.d/${DOMAIN}/
Mac:linux-ot$ sudo cp ca.crt /etc/docker/certs.d/${DOMAIN}/ca.crt
Mac:linux-ot$
Mac:linux-ot$ cat ca.crt | sudo tee -a /etc/ssl/certs/ca-certificates.crt
-----BEGIN CERTIFICATE-----
MIIDcDCCAligAwIBAgIRANOLAjECYd1TSCjCfF8uIcwwDQYJKoZIhvcNAQELBQAw
SzEQMA4GA1UEChMHQWNtZSBDbzE3MDUGA1UEAxMuS3ViZXJuZXRlcyBJbmdyZXNz
...
Z4As4XDW01De9zLd8t1RWriA3aBLtXIDcXSYgm6O1L6v2VyjzxSZiuIBiv9HlPQ5
/CrWUd8znYbe5Ur6v3kKv29yzc4=
-----END CERTIFICATE-----
Mac:linux-ot$
I also tried adding the “insecure-registries” in the Docker daemon.json that didn’t exist before:
Mac:linux-ot$ cat /etc/docker/daemon.json
{
  "insecure-registries" : ["registry-sbx.it.dbi-services.com"]
}
Mac:linux-ot$
But despite all that, after the restart of Rancher Desktop, pushing the images still didn’t work. I also saw some references about needing to use “http://” in the Docker daemon.json “insecure-registries” configuration, even for https registries, but still no luck. The error was that the SSL Certificate received was valid for “ingress.local” but the registry used was “registry-sbx.it.dbi-services.com” and of course the same output was given even if I only executed the “docker push” command manually (outside of the script):
Mac:linux-ot$ ./build.sh
**********************************************
*** Building the image 'linux-ot:8.10-901' ***
**********************************************

WARNING: experimental flag squash is removed with BuildKit. You should squash inside build using a multi-stage Dockerfile for efficiency.
[+] Building 489.8s (10/10) FINISHED                                                                            docker:rancher-desktop
 => [internal] load build definition from Dockerfile                                                                              0.1s
 => => transferring dockerfile: 3.12kB                                                                                            0.0s
 => [internal] load .dockerignore                                                                                                 0.1s
 => => transferring context: 2B                                                                                                   0.0s
 => [internal] load metadata for registry.access.redhat.com/ubi8:8.10-901.1716482497                                              3.3s
...
 => exporting to image                                                                                                           22.5s
 => => exporting layers                                                                                                          22.4s
 => => writing image sha256:03b090f94723c8947126cd7bfbc9a152612de44baab58417f85e7d1d2e46a5fa                                      0.0s
 => => naming to registry-sbx.it.dbi-services.com/dbi_dctm/linux-ot:8.10-901                                                      0.0s

The push refers to repository [registry-sbx.it.dbi-services.com/dbi_dctm/linux-ot]
Get "https://registry-sbx.it.dbi-services.com/v2/": tls: failed to verify certificate: x509: certificate is valid for ingress.local, not registry-sbx.it.dbi-services.com

*********************************************************
*** Script completed for 'dbi_dctm/linux-ot:8.10-901' ***
*********************************************************
Mac:linux-ot$
Mac:linux-ot$ docker push registry-sbx.it.dbi-services.com/dbi_dctm/linux-ot:8.10-901
The push refers to repository [registry-sbx.it.dbi-services.com/dbi_dctm/linux-ot]
Get "https://registry-sbx.it.dbi-services.com/v2/": tls: failed to verify certificate: x509: certificate is valid for ingress.local, not registry-sbx.it.dbi-services.com
Mac:linux-ot$
At that time, nobody could change/fix the certificate used by the registry, but I knew some of my colleagues used “nerdctl” instead of “docker”, so I decided to try it:
Mac:linux-ot$ nerdctl images
FATA[0000] cannot access containerd socket "/run/k3s/containerd/containerd.sock" (hint: try running with `--address /var/run/docker/containerd/containerd.sock` to connect to Docker-managed containerd): no such file or directory
Error: exit status 1
Mac:linux-ot$
While looking into the options of Rancher Desktop, I saw it was possible to choose between two container engines. For that purpose, in the main window, click on the Gear on the top right corner (old versions of Rancher Desktop) or on the Preferences button on the bottom left corner (new versions of Rancher Desktop) and select Container Engine (or Rancher Desktop menu icon > Open preferences dialog > Container Engine). Here are screenshots of an old version of Rancher Desktop first, and then a newer/recent version of Rancher Desktop:
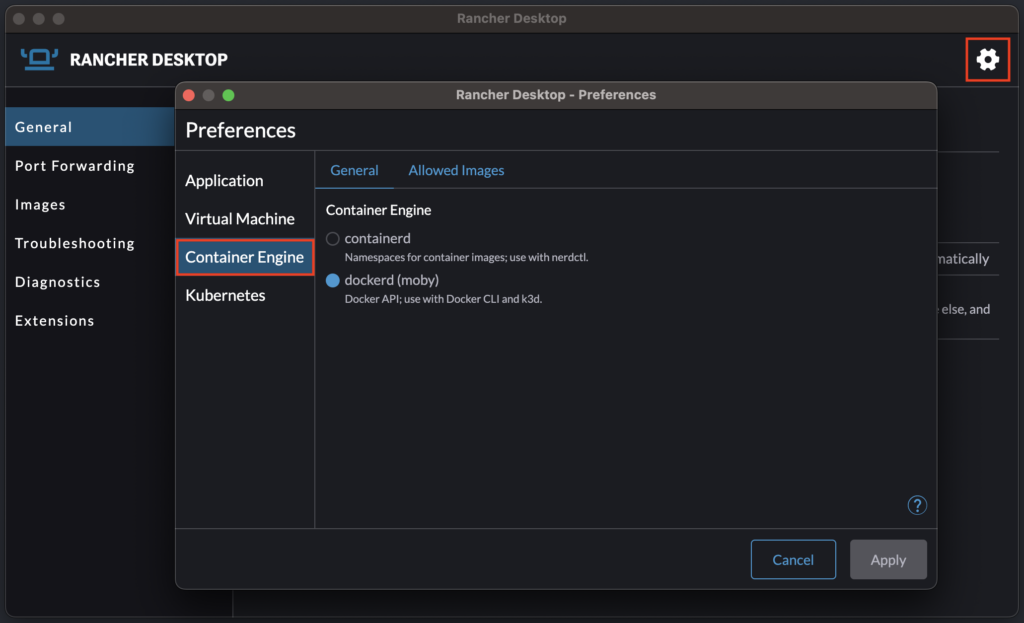
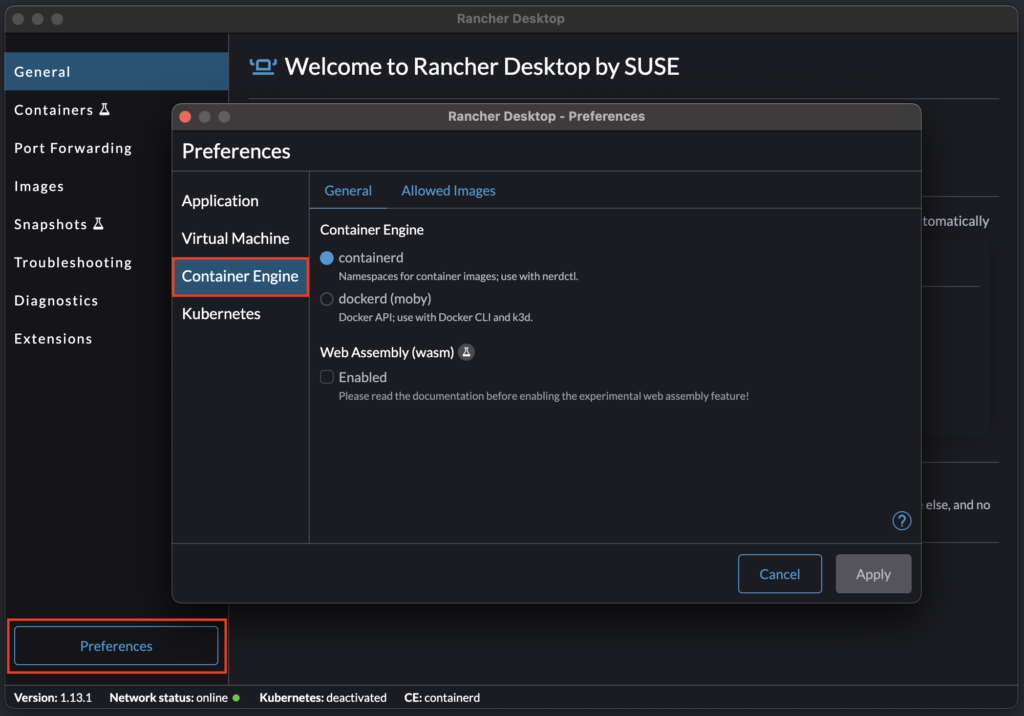
As you can see in the error above, “nerdctl” requires “containerd”. Therefore, I changed my container engine from “dockerd” to “containerd” and restarted Rancher Desktop. I had to change a little bit the build script since not all command line parameters are available in “nerdctl”, apparently, and I also took this opportunity to include the “insecure-registry” in the command line, as this is possible with “nerdctl” (not with “dockerd”). Therefore, my updated script looked like this:
...
nerdctl build --no-cache --rm \
  --tag="${REGISTRY}/${OWNER}/${NAME}" \
  --build-arg ARG_BASE_IMAGE="${BASE_IMAGE}" \
  --build-arg ARG_ENV="${ENV}" .
echo
nerdctl push --insecure-registry ${REGISTRY}/${OWNER}/${NAME}
...
This time, the build and the push of the image with nerdctl were both successful:
Mac:linux-ot$ ./build.sh
**********************************************
*** Building the image 'linux-ot:8.10-901' ***
**********************************************

[+] Building 507.0s (10/10)
[+] Building 507.2s (10/10) FINISHED
 => [internal] load build definition from Dockerfile                                                                              0.2s
 => => transferring dockerfile: 3.12kB                                                                                            0.1s
 => [internal] load .dockerignore                                                                                                 0.2s
 => => transferring context: 2B                                                                                                   0.1s
 => [internal] load metadata for registry.access.redhat.com/ubi8:8.10-901.1716482497                                              5.8s
...
 => exporting to docker image format                                                                                             35.5s
 => => exporting layers                                                                                                          20.8s
 => => exporting manifest sha256:9b9b6662b7a790c39882f8b4fd22e2b85bd4c419b6f6ffd350e447c35b2650f7                                 0.0s
 => => exporting config sha256:1a4e6c6559a2d7c39a987537691f67b677640eada5ecdcdcc03ec210f7c672bf                                   0.0s
 => => sending tarball                                                                                                           14.7s
Loaded image: registry-sbx.it.dbi-services.com/dbi_dctm/linux-ot:8.10-901

INFO[0000] pushing as a reduced-platform image (application/vnd.docker.distribution.manifest.v2+json, sha256:9b9b6662b7a790c39882f8b4fd22e2b85bd4c419b6f6ffd350e447c35b2650f7)
WARN[0000] skipping verifying HTTPS certs for "registry-sbx.it.dbi-services.com"
manifest-sha256:9b9b6662b7a790c39882f8b4fd22e2b85bd4c419b6f6ffd350e447c35b2650f7: done           |++++++++++++++++++++++++++++++++++++++|
config-sha256:1a4e6c6559a2d7c39a987537691f67b677640eada5ecdcdcc03ec210f7c672bf:   done           |++++++++++++++++++++++++++++++++++++++|
elapsed: 42.0s                                                                    total:  17.1 K (416.0 B/s)

*********************************************************
*** Script completed for 'dbi_dctm/linux-ot:8.10-901' ***
*********************************************************
Mac:linux-ot$
So, in conclusion, there might be a way to make “dockerd” ignore Self-Signed SSL Certificate when it’s used as the embedded container engine inside Rancher Desktop but if it is, then it’s well hidden… If you know about it, don’t hesitate to share. In any cases, switching to “containerd” and “nerdctl” is a possible workaround when you just want to quickly start your development on your internal dev environment without having to worry about the certificate being used. Of course, pushing images with “nerdctl” means ignoring security in this case, which is never a good idea. Therefore, use it with caution and if you have a similar SSL Certificate issue, make sure to fix it as soon as possible so you can use the secure way.
L’article Push images to a Self-Signed Cert registry with Rancher Desktop est apparu en premier sur dbi Blog.
Hogging Threads check in Apache Tomcat
In Apache Tomcat, there is a Stuck Thread Detector Valve which can be enabled pretty easily through the Tomcat “server.xml” file. I talked about that in a previous blog already and provided an AWK parser to extract important details from the logs. However, Tomcat does not have, as far as I know, any notion of Hogging Threads. That’s what I will talk about in this blog.
Hogging ThreadsIf we take a WebLogic Server, as an example, there is a notion of both Hogging and Stuck Threads. There is a pretty short (and not really helpful) explanation of what a Hogging Thread is in the Doc ID 780411.1 and another one in the Doc ID 1517608.1. In summary, WebLogic has Work Managers that keeps track of requests currently being executed and their execution time. Every two seconds, WebLogic will calculate the average time it took to complete requests in the last couple minutes. It will then consider as a Hogging Thread any request that is currently taking more than 7 times the average. Therefore, if the calculated average is 10 seconds, Hogging Threads are requests that takes more than 7*10 = 70 seconds. If it completes before 600 seconds, then that’s it. However, if it stays in execution for more than 600s, then it becomes a Stuck Thread. In short, you can consider Hogging Threads as unusually slow requests.
Tomcat usual monitoringIf you look at most monitoring solutions of Tomcat, it will usually use JMX directly or indirectly through an Application deployed on Tomcat (or a JavaAgent). This will allow to extract existing metrics and use these Out-Of-The-Box values in Prometheus, Grafana, Zabbix, etc… However, this doesn’t really provide much useful information on the ThreadPool (or Executor) MBean. Tomcat only includes details about how many threads are currently busy (doing something) and what’s the maximum number of threads possible (as defined in the “server.xml“). But there is no runtime information or state on the requests… In another blog (damn, that was 8 years ago already!), I talked about a WLST script I wrote to be able to monitor a lot of things from WebLogic Servers and that included much more than what Tomcat gives you. The WebLogic JMX MBean is “ThreadPoolRuntimeMBean” and you can find details about all metrics that WebLogic provides here (example for WebLogic 12c).
Simple logic to implementIf you would like to have a Hogging Thread monitoring, you would need to build it yourself. I assume it should be possible to very closely develop/recreate the WebLogic Work Managers for Tomcat, but you would need Java and Tomcat knowledge to extend the HTTP Servlet or use a custom valve. However, it would modify the behavior of Tomcat and it would most probably have some performance impact as well… To stay simple and still provide something close to it, I thought about doing something like that: since you will need to enable the Stuck Thread Detector Valve to obtain details related to the Stuck Threads, you could set the threshold of this valve to 70/100/120s for example. Then you could consider all detected threads as Hogging from the moment it appears on the Tomcat logs and until it gets completed OR until it becomes a Stuck Thread (600s if we keep it aligned with WebLogic).
WebLogic considers user requests to calculate the average and ignores anything related to internal processing. On Tomcat, you could simulate something close to that by looking at the access log and taking the values from ‘%T‘ (time taken to process the request in seconds) or ‘%F‘ (time taken to commit the response in milliseconds), c.f. the documentation. For example, taking all lines from the last 2 minutes, calculating the average time taken of all these, and multiplying that by 7. That would give you a close-enough behavior to WebLogic. But how do you find Threads running for longer than that (this average changing every time it gets calculated!) without extending Tomcat? The access log will only contain completed requests and not on-going ones… To do that, you will anyway need to extend the HTTP Servlet or use a custom valve, from my point of view.
Example of detection for Hogging ThreadsIn this section, I will use the simple approach I mentioned above, that uses a fixed amount of time to decide if a thread is Hogging or not. Depending on your application, the value to use might be 50, 90, 120 or whatever makes sense to you. Here I will use 120s as a baseline. Therefore, my Tomcat “server.xml” content is as follow:
[tomcat@d2-0 ~]$ grep -A1 Stuck $TOMCAT_HOME/conf/server.xml
        <Valve className="org.apache.catalina.valves.StuckThreadDetectionValve"
               threshold="120" />
[tomcat@d2-0 ~]$
If I take the AWK parser I shared on this blog, then I would get this kind of outcome:
[tomcat@d2-0 ~]$ cat $TOMCAT_HOME/logs/catalina.out | awk -f parse_stuck.awk
============================================
========== COMPLETED LONG THREADS ==========
============================================
THREAD                                      STIME           DTIME     DURATION           CTIME    NUM    REQUEST
https-jsse-nio-8080-exec-41     [6/15/24 5:44 AM]    05:46:22,268    [131,487]    05:46:32,271      0    [https://dctm-env.domain.com/D2/x3_portal/loginService]
https-jsse-nio-8080-exec-26     [6/15/24 7:48 AM]    07:50:33,630    [128,939]    07:50:43,633      0    [https://dctm-env.domain.com/D2/x3_portal/creationService]
https-jsse-nio-8080-exec-27    [6/15/24 10:17 AM]    10:19:26,921    [131,451]    10:19:36,925      0    [https://dctm-env.domain.com/D2/x3_portal/doclistService]
https-jsse-nio-8080-exec-1     [6/15/24 10:19 AM]    10:21:36,952    [129,760]    10:21:46,954      0    [https://dctm-env.domain.com/D2/x3_portal/searchManagerService]
https-jsse-nio-8080-exec-26    [6/15/24 11:49 AM]    11:51:43,233    [124,429]    11:51:46,368      0    [https://dctm-env.domain.com/D2/servlet/ExportContent?uid=...]

============================================
======= CURRENT LONG RUNNING THREADS =======
============================================
THREAD                                      STIME           DTIME     DURATION    REQUEST
https-jsse-nio-8080-exec-34    [6/15/24 12:18 AM]    12:20:24,530    [122,150]    [https://dctm-env.domain.com/D2/x3_portal/loginService]
https-jsse-nio-8080-exec-66    [6/15/24 12:25 AM]    12:27:10,305    [120,300]    [https://dctm-env.domain.com/D2/x3_portal/searchManagerService]
https-jsse-nio-8080-exec-2     [6/15/24 12:30 AM]    12:32:05,982    [121,495]    [https://dctm-env.domain.com/D2/x3_portal/creationService]
[tomcat@d2-0 ~]$
On that output, there are 5 threads that took around 130s but that are completed. However, there are still 3 threads that haven’t completed yet. In terms of Stuck and Hogging threads, what matters is what is still currently running. Therefore, we shouldn’t take care of completed ones. What is important for a monitoring is, at least, to receive the number of Stuck/Hogging threads. You might want to include the request URL as well, so you can detect specific issues in case a lot of requests are Stuck/Hogging on the same service. In this blog, I will only care about the number.
For that purpose, let’s simplify a bit the AWK parser, creating a new one with this content (as a reminder, this parser depends on the log format):
[tomcat@d2-0 ~]$ cat thread.awk
/./ {
  sub("UTC","");
}

/org.apache.catalina.valves.StuckThreadDetectionValve.notifyStuckThreadDetected/ {
  thread=substr($7,2,length($7)-2);
  dtime[thread]=$1"_"$2;
  tmp=substr($0,index($0,"active for ")+11);
  duration[thread]=substr(tmp,1,index(tmp," ")-1);
  not_ended[thread]=0;
}

/org.apache.catalina.valves.StuckThreadDetectionValve.notifyStuckThreadCompleted/ {
  thread=substr($7,2,length($7)-2);
  tmp=substr($0,index($0,"approximately ")+14);
  duration[thread]=substr(tmp,1,index(tmp," ")-1);
  not_ended[thread]=1;

  dtime[thread]="";
  duration[thread]=="";
  not_ended[thread]=="";
}

END {
  for ( i in not_ended ) {
    if (not_ended[i]==0) {
      printf("%s\t%10s\n",dtime[i],duration[i]);
    }
  }
}
[tomcat@d2-0 ~]$
To validate it, I executed it on the exact same log file, and I expected only 3 rows, fetching only the detection time and the current duration of the thread. I got exactly what I expected:
[tomcat@d2-0 ~]$ cat $TOMCAT_HOME/logs/catalina.out | awk -f thread.awk
2024-06-15_12:20:24,530  [122,150]
2024-06-15_12:27:10,305  [120,300]
2024-06-15_12:32:05,982  [121,495]
[tomcat@d2-0 ~]$
My goal from here was to find the exact start time of the request and compare it with the current date/time. If the resulting difference is lower than 600, then I would consider the thread as Hogging, otherwise as Stuck. This is because whatever appears on the log has been running since 120s at least, as defined in the threshold of the Stuck Thread Detector Valve. Doing that in bash is pretty easy:
[tomcat@d2-0 ~]$ ls -l thread.*
-rw-------. 1 tomcat tomcat  731 Jun 15 11:28 thread.awk
-rwxr-x---. 1 tomcat tomcat 1200 Jun 15 11:50 thread.sh
[tomcat@d2-0 ~]$
[tomcat@d2-0 ~]$ cat thread.sh
#!/bin/bash

# Variables
script_folder=`which ${0}`
script_folder=`dirname ${script_folder}`
parse_awk="${script_folder}/thread.awk"
input_log="$TOMCAT_HOME/logs/catalina.out"
nb_stuck_threads=0
nb_hogging_threads=0
current_time=`date +%s`

# Parse log file to retrieve long running threads
while read line; do
  thread_detection=`echo ${line} | awk -F, '{print $1}' | sed 's,_, ,'`
  thread_duration=`echo ${line} | awk -F\[ '{print $2}' | awk -F, '{print $1}'`
  thread_detection_epoch=`date -d "${thread_detection} UTC" +%s`
  thread_start="$(( ${thread_detection_epoch} - ${thread_duration} ))"
  thread_age="$(( ${current_time} - ${thread_start} ))"
  if [[ ${thread_age} -ge 600 ]]; then
    nb_stuck_threads=$(( nb_stuck_threads + 1 ))
  else
    nb_hogging_threads=$(( nb_hogging_threads + 1 ))
  fi
done < <(cat ${input_log} | awk -f ${parse_awk})

echo "$(date --utc) -- ${nb_stuck_threads} Stuck // ${nb_hogging_threads} Hogging"
[tomcat@d2-0 ~]$
And it’s execution:
[tomcat@d2-0 ~]$ ./thread.sh
Sat Jun 15 12:34:40 UTC 2024 -- 1 Stuck // 2 Hogging
[tomcat@d2-0 ~]$
[tomcat@d2-0 ~]$ ./thread.sh
Sat Jun 15 12:35:21 UTC 2024 -- 2 Stuck // 1 Hogging
[tomcat@d2-0 ~]$
Is that the expected outcome? Yes, there are 3 running threads that were detected between 12:20 and 12:32. At that time, these threads were running since 120 to 122 seconds already, meaning the execution started at, respectively, 12:18:22, 12:25:10 and 12:30:04. Therefore, the first execution of the shell script being at 12:34:40, that means that only the 1st of the 3 threads is over 10 minutes old (16min 18s exactly), the 2 others are still below (9min 30s & 4min 36s respectively). Then, the second execution being at 12:35:21, it means that the middle thread is now 10min 11s old: it’s not a Hogging Thread anymore, but a Stuck Thread.
That’s just a quick example and as mentioned, it could be improved by not only giving the number of threads but instead a mapping of threads vs URLs to detect trends. The output would also depends on the monitoring system that would fetch this data.
L’article Hogging Threads check in Apache Tomcat est apparu en premier sur dbi Blog.
Is DPR compatible with 12.1 databases running on your ODA?
Since patch version 19.21 (current one is 19.23), ODA (Oracle Database Appliance) X7, X8 and X9 will require the use of Data Preserving Reprovisioning (DPR) to get the patch. Unlike traditional patching, DPR erases the system disks but keeps data on ASM/ACFS disks. Data includes databases, ACFS volumes, DB homes, vDisks for DB Systems and VMs. But it doesn’t keep your system settings: specific OS configurations, additional tools, monitoring, users and groups, aso. The reason for not being able to use classic patching method: the embedded OS upgrade from Linux 7 to Linux 8. Actually, it’s much easier to setup a brand new system than applying a major patch onto an existing one. But what about your old (and unsupported) Oracle database releases? Let’s find out for 12cR1 databases.
ODA’s hardware and software supportAccording to MOS note Doc ID 2757884.1, only ODAs X7, X8, X9 and X10 series are currently supported. The support is valid if you run at least patch version 19.19. The only database versions supported are 19c in bare metal, and 21c and 19c as DB Systems.
There is no more support for older releases, like 12cR1 for example. But it doesn’t mean that 12cR1 will stop working as soon as you’re deploying patch 19.19 or higher. With classic patching, your old databases will still be OK. Patching with DPR is another story. As old releases are no more supported, you may struggle to plug in back your old databases to the new Linux system. One could advice to upgrade all your databases to 19c prior using DPR, but it’s not so easy for a lot of my clients. Many old databases are legacy and must run for another couple of years. And 12cR1 is the main release that must survive through patching.
Environment and contextI worked on this following example 2 weeks ago:
- an ODA X8-2M running patch 19.18
- patching is done once a year, and this time I need to update to version 19.22 and I must use DPR
- most of the databases are running 19.18
- 4 databases are still running 12cR1 from initial version (19.15)
- these 12cR1 databases were not patched during last year’s update from 19.15 to 19.18 as no more patch existed for 12cR1 in 19.18
There is no reason 12cR1 would stop working after this OS upgrade: 12cR1 is supported (so to say) on Linux 8, as mentioned in the certification matrix on MOS.
DPR preupgradeDPR means reimaging the ODA, but before reimaging, you will need to register the 19.22 patch and update the DCS components. The adequate preupgrade and detach-node operations resides within the patch.
odacli update-repository -f /backup/patch/19_22/oda-sm-19.22.0.0.0-240306-server.zip
sleep 60 ; odacli describe-job -i "16596d34-9b93-4c7d-b502-4ad27804fa69"
...

odacli update-dcsadmin -v 19.22.0.0.0
sleep 120 ; odacli describe-job -i "aed1c8ef-713b-43c2-9355-cb364387dcd0"
...

odacli update-dcscomponents -v 19.22.0.0.0
...

odacli update-dcsagent -v 19.22.0.0.0
sleep 180 ; odacli describe-job -i 1a10900c-2fc7-4535-8f9b-879a43243e66
...
Once your ODA has the knowledge of what’s needed for DPR to 19.22, let’s do the preupgrade operation:
odacli create-preupgradereport -bm
Preupgrade will check a lot of prerequisites, but let’s focus on 12cR1:
odacli describe-preupgradereport -i b1f6dddb-c531-45d5-842f-bf3cf10231fe
Upgrade pre-check report
------------------------------------------------------------------------
                 Job ID:  b1f6dddb-c531-45d5-842f-bf3cf10231fe
            Description:  Run pre-upgrade checks for Bare Metal
                 Status:  FAILED
                Created:  April 15, 2024 1:47:17 PM CEST
                 Result:  One or more pre-checks failed for [DB]

...

Validate Database Version      Failed   Version '12.1.0.2.220419' for          Please update the database to the
                                        database 'BRCLATST' is lower than      minimum supported version or higher
                                        minimum supported version
                                        '12.1.0.2.220719'
...
Validate Database Version      Failed   Version '12.1.0.2.220419' for          Please update the database to the
                                        database 'BRSLTST' is lower than       minimum supported version or higher
                                        minimum supported version
                                        '12.1.0.2.220719'
...
Validate Database Version      Failed   Version '12.1.0.2.220419' for          Please update the database to the
                                        database 'BRRTST' is lower than        minimum supported version or higher
                                        minimum supported version
                                        '12.1.0.2.220719'

...
Validate Database Version      Failed   Version '12.1.0.2.220419' for          Please update the database to the
                                        database 'BRFTST' is lower than        minimum supported version or higher
                                        minimum supported version
                                        '12.1.0.2.220719'
...
Hopefully, my 4 databases are not declared unsupported or not compatible with 19.22. But they are using patch 12.1.0.2.220419 as deployed with ODA version 19.15, and I will need to upgrade them to 12.1.0.2.220719. This is the latest version embedded in the latest ODA patch that supports 12cR1: 19.16. It should be quite easy to apply.
Registering the DB home and apply the patch?I thought I could simply download the DB clone, register it in the repository, and apply the patch, but applying the patch on a DB home will also need the system patch. Because the target version for updating a DB home is an ODA patch number, and metadata inside the system patch makes the link to the associated DB home. No problem to register this old patch, even if you currently run a higher version:
odacli update-repository -f /backup/patch/19_22/odacli-dcs-19.16.0.0.0-220805-DB-12.1.0.2.zip
sleep 60 ; odacli describe-job -i "304762d3-948b-419b-9954-0d402da8304d"
...

odacli update-repository -f /backup/patch/19_22/oda-sm-19.16.0.0.0-220809-server.zip
sleep 60 ; odacli describe-job -i "4e75492b-60d4-4351-9966-80fdec97b312"
...

odacli list-dbhomes
ID                                       Name                 DB Version           DB Edition Home Location                                            Status
---------------------------------------- -------------------- -------------------- ---------- -------------------------------------------------------- ----------
1cbe3f74-2746-4ab0-81f9-2d1b9f5c3d56     OraDB12102_home1     12.1.0.2.220419      EE         /u01/app/odaorahome/oracle/product/12.1.0.2/dbhome_1     CONFIGURED
94aba6b1-850b-45d5-b123-c9eade003fa8     OraDB19000_home2     19.18.0.0.230117     EE         /u01/app/odaorahome/oracle/product/19.0.0.0/dbhome_2     CONFIGURED
odacli create-prepatchreport -d -i 1cbe3f74-2746-4ab0-81f9-2d1b9f5c3d56 -v 19.16.0.0
sleep 180 ; odacli describe-prepatchreport -i 55a5e235-096d-4d26-b922-4194c361b16f
...
odacli update-dbhome -i 1cbe3f74-2746-4ab0-81f9-2d1b9f5c3d56 -v 19.16.0.0.0 -f
...
Once the update is finished, the old DB home can be safely removed:
odacli list-dbhomes
ID                                       Name                 DB Version           DB Edition Home Location                                            Status
---------------------------------------- -------------------- -------------------- ---------- -------------------------------------------------------- ----------
1cbe3f74-2746-4ab0-81f9-2d1b9f5c3d56     OraDB12102_home1     12.1.0.2.220419      EE         /u01/app/odaorahome/oracle/product/12.1.0.2/dbhome_1     CONFIGURED
94aba6b1-850b-45d5-b123-c9eade003fa8     OraDB19000_home2     19.18.0.0.230117     EE         /u01/app/odaorahome/oracle/product/19.0.0.0/dbhome_2     CONFIGURED
f715ab11-12a7-4fef-940a-19b71500a93d     OraDB12102_home3     12.1.0.2.220719      EE         /u01/app/odaorahome/oracle/product/12.1.0.2/dbhome_3     CONFIGURED

odacli delete-dbhome -i 1cbe3f74-2746-4ab0-81f9-2d1b9f5c3d56

odacli describe-job -i 1b1162a5-38d8-439b-af93-aa7246e69ff9
...Let’s retry the preupgrade:
odacli create-preupgradereport -bm
Status is now OK:
odacli describe-preupgradereport -i a2cc67c4-fb43-4556-9e3c-a02b9e53736d
Upgrade pre-check report
------------------------------------------------------------------------
				 Job ID:  a2cc67c4-fb43-4556-9e3c-a02b9e53736d
			Description:  Run pre-upgrade checks for Bare Metal
				 Status:  SUCCESS
				Created:  May 27, 2024 2:02:41 PM CEST
				 Result:  All pre-checks succeeded
...
Now let’s do the detach to prepare our ODA for reimaging:
odacli detach-node -all
********************************************************************************
								  IMPORTANT
********************************************************************************
'odacli detach-node' will bring down the databases and grid services on the
system. The files that belong to the databases, which are stored on ASM or ACFS,
are left intact on the storage. The databases will be started up back after
re-imaging the ODA system using 'odacli restore-node' commands. As a good
precautionary measure, please backup all the databases on the system before you
start this process. Do not store the backup on this ODA machine since the local
file system will be wiped out as part of the re-image.
********************************************************************************

Do you want to continue (yes/no)[no] : yes

odacli describe-job -i "37cbd5df-708f-4631-872d-f574dd1279e0"
Job details
----------------------------------------------------------------
                     ID:  37cbd5df-708f-4631-872d-f574dd1279e0
            Description:  Detach node service creation for upgrade
                 Status:  Success
                Created:  May 27, 2024 2:35:38 PM CEST
                Message:  On successful job completion, the server archive file will be generated at /opt/oracle/oak/restore/out. Please copy the server archive file outside of the ODA system before re-image
...
Detach is OK. You must now copy the content of /opt/oracle/oak/restore/out outside the ODA, for example on a NFS share and/or your local computer. YOU MUST DO THIS BACKUP BEFORE REIMAGING unless you will not be able to use your data anymore. These files are mandatory for attaching again your data to the new system version.
ReimagingReimaging is done through the ILOM as described in the ODA documentation. Just connect the 19.22 ISO under the storage menu of the remote console of the server, define CDROM as the next boot device, and do a power cycle.
Reimaging is an automated process and it takes less than 1 hour to complete.
Firstnet configurationOur system is now “brand new”, and you will need to connect with default credentials (root/welcome1) on the remote console to do the firstnet configuration:
configure-firstnet
You can find parameters for this initial network configuration inside the detach zipfile:
cat serverarchive_oratest04/restore/configure-firstnet.rsp
# ------------------------------------------------------------
# This file was generated by the ODA detach-node code flow.
# Don't modify this file
#
# Created On: 2024-05-27 14:35:38
# Version: 19.22.0.0.0
# Feature: Data Preserving
# Re-provisioning
#
# To be used for configure-firstnet post
# reimage
# ------------------------------------------------------------

HOSTNAME=oratest04
INTERFACE_NAME=btbond1
VLAN=NO
IP_ADDR=10.10.32.126
SUBNET_MASK=255.255.255.0
GATEWAY=10.10.32.1
Now the server is back online in your network, and you may connect your NFS shares, for example the one where the patchfiles reside:
echo "10.10.32.100:/data/vol_data_490/ODA_backups /backup nfs defaults  0 0" >> /etc/fstab
systemctl daemon-reload
mkdir /backup
mount -aReimaging never updates the firmwares (BIOS, ILOM, etc), you’ll have to update them right now:
odacli describe-component
System Version
---------------
19.22.0.0.0

System node Name
---------------
oak

Local System Version
---------------
19.22.0.0.0

Component                                Installed Version    Available Version
---------------------------------------- -------------------- --------------------
OAK
						  19.22.0.0.0           up-to-date
DCSCONTROLLER
						  19.22.0.0.0           up-to-date
DCSCLI
						  19.22.0.0.0           up-to-date
DCSAGENT
						  19.22.0.0.0           up-to-date
DCSADMIN
						  19.22.0.0.0           up-to-date
OS
						  8.9                   up-to-date
ILOM
						  5.1.0.23.r146986      5.1.3.20.r153596
BIOS
						  52080100              52110200
LOCAL CONTROLLER FIRMWARE
						  8000C470              8000D9AB
SHARED CONTROLLER FIRMWARE
						  VDV1RL05              VDV1RL06
LOCAL DISK FIRMWARE
						  D3MU001               up-to-date
HMP
						  2.4.9.2.600           up-to-date


odacli update-repository -f /backup/patch/19_22/Server/oda-sm-19.22.0.0.0-240306-server.zip

sleep 60 ; odacli describe-job -i "b341b9cd-0294-4112-a080-24466a3a13e7"
...

odacli create-prepatchreport -s -v 19.22.0.0.0

sleep 180 ; odacli describe-prepatchreport -i afd38dae-69f7-46a2-abe6-cff15b31ad37
Patch pre-check report
------------------------------------------------------------------------
Job ID:  afd38dae-69f7-46a2-abe6-cff15b31ad37
Description:  Patch pre-checks for [OS, ILOM, SERVER]
Status:  SUCCESS
Created:  May 27, 2024 2:35:22 PM UTC
Result:  All pre-checks succeeded

...

odacli update-server -v 19.22.0.0.0

odacli describe-job -i "3bf82e72-eda6-4e03-b363-ee872b7ca8e8"
Job details
----------------------------------------------------------------
Job ID:  3bf82e72-eda6-4e03-b363-ee872b7ca8e8
Description:  Server Patching
Status:  Success
Created:  May 27, 2024 2:37:02 PM UTC
Message:

...
Server reboots at the end of this update. Note that you may need to wait several minutes after the reboot to see BIOS and ILOM updated.
odacli describe-component
System Version
---------------
19.22.0.0.0

System node Name
---------------
oak

Local System Version
---------------
19.22.0.0.0

Component                                Installed Version    Available Version
---------------------------------------- -------------------- --------------------
OAK
						  19.22.0.0.0           up-to-date
DCSCONTROLLER
						  19.22.0.0.0           up-to-date
DCSCLI
						  19.22.0.0.0           up-to-date
DCSAGENT
						  19.22.0.0.0           up-to-date
DCSADMIN
						  19.22.0.0.0           up-to-date
OS
						  8.9                   up-to-date
ILOM
						  5.1.3.20.r153596      up-to-date
BIOS
						  52110200              up-to-date
LOCAL CONTROLLER FIRMWARE
						  8000D9AB              up-to-date
SHARED CONTROLLER FIRMWARE
						  VDV1RL05              VDV1RL06
LOCAL DISK FIRMWARE
						  D3MU001               up-to-date
HMP
						  2.4.9.2.600           up-to-date
Now let’s patch the storage:
odacli update-storage -v 19.22.0.0.0

odacli describe-job -i f829abeb-5755-491c-9463-825b0eca5409
...
The server reboots again, then checking the version shows that everything is “up-to-date”:
odacli describe-component
System Version
---------------
19.22.0.0.0

System node Name
---------------
oak

Local System Version
---------------
19.22.0.0.0

Component                                Installed Version    Available Version
---------------------------------------- -------------------- --------------------
OAK
						  19.22.0.0.0           up-to-date
DCSCONTROLLER
						  19.22.0.0.0           up-to-date
DCSCLI
						  19.22.0.0.0           up-to-date
DCSAGENT
						  19.22.0.0.0           up-to-date
DCSADMIN
						  19.22.0.0.0           up-to-date
OS
						  8.9                   up-to-date
ILOM
						  5.1.3.20.r153596      up-to-date
BIOS
						  52110200              up-to-date
LOCAL CONTROLLER FIRMWARE
						  8000D9AB              up-to-date
SHARED CONTROLLER FIRMWARE
						  VDV1RL06              up-to-date
LOCAL DISK FIRMWARE
						  D3MU001               up-to-date
HMP
						  2.4.9.2.600           up-to-date
Let’s register the GI clone version 19.22 as well as the detach files, then restore the ODA configuration:
odacli update-repository -f /backup/patch/19_22/Grid/odacli-dcs-19.22.0.0.0-240306-GI-19.22.0.0.zip

odacli describe-job -i "d8b33efb-9f66-461c-89ea-f0db33e22cba"
...

odacli update-repository -f /backup/patch/19_22/oratest04/root/oda_nodes/serverarchive_oratest04.zip

odacli describe-job -i "e0c5b0cf-86bb-4961-9861-1ef598b9d6d9"
...

odacli restore-node -g
Enter New system password: *************
Retype New system password: *************
Enter an initial password for Web Console account (oda-admin): *************
Retype the password for Web Console account (oda-admin): *************
User 'oda-admin' created successfully...

odacli describe-job -i 3f2aed36-b654-4df5-ab63-23a740adb5cc
...
Restore node takes 25+ minutes.
Restore node – databasesNow it’s time to restore our databases:
odacli restore-node -d
odacli describe-job -i "0081ba7a-f987-40ef-95af-62654c18e354"
Job details
----------------------------------------------------------------
Job ID: 0081ba7a-f987-40ef-95af-62654c18e354
Description: Restore node service - DB
Status: Success
Created: May 27, 2024 5:51:25 PM CEST
Message:
Task Name Start Time End Time Status
---------------------------------------- ---------------------------------------- ---------------------------------------- -------
Setting up SSH equivalence for 'oracle' May 27, 2024 5:51:29 PM CEST May 27, 2024 5:51:30 PM CEST Success
Restore BM CPU Pools May 27, 2024 5:51:30 PM CEST May 27, 2024 5:51:30 PM CEST Success
Register DB home: OraDB19000_home2 May 27, 2024 5:51:30 PM CEST May 27, 2024 5:51:33 PM CEST Success
Register DB home: OraDB12102_home3 May 27, 2024 5:51:33 PM CEST May 27, 2024 5:51:57 PM CEST Success
Persist database storage locations May 27, 2024 5:51:57 PM CEST May 27, 2024 5:51:57 PM CEST Success
Save metadata for MCHDEV May 27, 2024 5:51:57 PM CEST May 27, 2024 5:51:57 PM CEST Success
Save metadata for MCHREF May 27, 2024 5:51:57 PM CEST May 27, 2024 5:51:57 PM CEST Success
Save metadata for LV01DEV May 27, 2024 5:51:57 PM CEST May 27, 2024 5:51:57 PM CEST Success
Save metadata for LV02DEV May 27, 2024 5:51:57 PM CEST May 27, 2024 5:51:57 PM CEST Success
Save metadata for MCHTST May 27, 2024 5:51:57 PM CEST May 27, 2024 5:51:57 PM CEST Success
Save metadata for LV02TST May 27, 2024 5:51:57 PM CEST May 27, 2024 5:51:57 PM CEST Success
Save metadata for MCHBAC May 27, 2024 5:51:57 PM CEST May 27, 2024 5:51:57 PM CEST Success
Save metadata for BRRTST May 27, 2024 5:51:57 PM CEST May 27, 2024 5:51:57 PM CEST Success
Save metadata for LV01TST May 27, 2024 5:51:57 PM CEST May 27, 2024 5:51:57 PM CEST Success
Save metadata for DBTEST May 27, 2024 5:51:57 PM CEST May 27, 2024 5:51:57 PM CEST Success
Save metadata for KGED19TS May 27, 2024 5:51:57 PM CEST May 27, 2024 5:51:57 PM CEST Success
Save metadata for BRFTST May 27, 2024 5:51:57 PM CEST May 27, 2024 5:51:57 PM CEST Success
Save metadata for BRSLTST May 27, 2024 5:51:57 PM CEST May 27, 2024 5:51:57 PM CEST Success
Save metadata for BRCLATST May 27, 2024 5:51:57 PM CEST May 27, 2024 5:51:57 PM CEST Success
Persist database storages May 27, 2024 5:51:57 PM CEST May 27, 2024 5:51:57 PM CEST Skipped
Restore database: MCHDEV May 27, 2024 5:51:57 PM CEST May 27, 2024 5:53:03 PM CEST Success
+-- Adding database to GI May 27, 2024 5:51:57 PM CEST May 27, 2024 5:51:59 PM CEST Success
+-- Adding database instance(s) to GI May 27, 2024 5:51:59 PM CEST May 27, 2024 5:51:59 PM CEST Success
+-- Modifying SPFILE for database May 27, 2024 5:51:59 PM CEST May 27, 2024 5:52:33 PM CEST Success
+-- Restore password file for database May 27, 2024 5:52:33 PM CEST May 27, 2024 5:52:33 PM CEST Skipped
+-- Start instance(s) for database May 27, 2024 5:52:33 PM CEST May 27, 2024 5:52:49 PM CEST Success
+-- Persist metadata for database May 27, 2024 5:52:49 PM CEST May 27, 2024 5:52:49 PM CEST Success
+-- Create adrci directory May 27, 2024 5:52:49 PM CEST May 27, 2024 5:52:49 PM CEST Success
+-- Run SqlPatch May 27, 2024 5:52:49 PM CEST May 27, 2024 5:53:03 PM CEST Success
Restore database: MCHREF May 27, 2024 5:53:03 PM CEST May 27, 2024 5:54:03 PM CEST Success
+-- Adding database to GI May 27, 2024 5:53:03 PM CEST May 27, 2024 5:53:04 PM CEST Success
+-- Adding database instance(s) to GI May 27, 2024 5:53:04 PM CEST May 27, 2024 5:53:04 PM CEST Success
+-- Modifying SPFILE for database May 27, 2024 5:53:04 PM CEST May 27, 2024 5:53:38 PM CEST Success
+-- Restore password file for database May 27, 2024 5:53:39 PM CEST May 27, 2024 5:53:39 PM CEST Skipped
+-- Start instance(s) for database May 27, 2024 5:53:39 PM CEST May 27, 2024 5:53:54 PM CEST Success
+-- Persist metadata for database May 27, 2024 5:53:54 PM CEST May 27, 2024 5:53:54 PM CEST Success
+-- Create adrci directory May 27, 2024 5:53:54 PM CEST May 27, 2024 5:53:54 PM CEST Success
+-- Run SqlPatch May 27, 2024 5:53:54 PM CEST May 27, 2024 5:54:03 PM CEST Success
Restore database: LV01DEV May 27, 2024 5:54:03 PM CEST May 27, 2024 5:55:15 PM CEST Success
+-- Adding database to GI May 27, 2024 5:54:03 PM CEST May 27, 2024 5:54:05 PM CEST Success
+-- Adding database instance(s) to GI May 27, 2024 5:54:05 PM CEST May 27, 2024 5:54:05 PM CEST Success
+-- Modifying SPFILE for database May 27, 2024 5:54:05 PM CEST May 27, 2024 5:54:40 PM CEST Success
+-- Restore password file for database May 27, 2024 5:54:40 PM CEST May 27, 2024 5:54:40 PM CEST Skipped
+-- Start instance(s) for database May 27, 2024 5:54:40 PM CEST May 27, 2024 5:54:55 PM CEST Success
+-- Persist metadata for database May 27, 2024 5:54:55 PM CEST May 27, 2024 5:54:55 PM CEST Success
+-- Create adrci directory May 27, 2024 5:54:55 PM CEST May 27, 2024 5:54:56 PM CEST Success
+-- Run SqlPatch May 27, 2024 5:54:56 PM CEST May 27, 2024 5:55:15 PM CEST Success
Restore database: LV02DEV May 27, 2024 5:55:15 PM CEST May 27, 2024 5:56:29 PM CEST Success
+-- Adding database to GI May 27, 2024 5:55:15 PM CEST May 27, 2024 5:55:17 PM CEST Success
+-- Adding database instance(s) to GI May 27, 2024 5:55:17 PM CEST May 27, 2024 5:55:17 PM CEST Success
+-- Modifying SPFILE for database May 27, 2024 5:55:17 PM CEST May 27, 2024 5:55:51 PM CEST Success
+-- Restore password file for database May 27, 2024 5:55:51 PM CEST May 27, 2024 5:55:51 PM CEST Skipped
+-- Start instance(s) for database May 27, 2024 5:55:51 PM CEST May 27, 2024 5:56:07 PM CEST Success
+-- Persist metadata for database May 27, 2024 5:56:07 PM CEST May 27, 2024 5:56:07 PM CEST Success
+-- Create adrci directory May 27, 2024 5:56:07 PM CEST May 27, 2024 5:56:07 PM CEST Success
+-- Run SqlPatch May 27, 2024 5:56:07 PM CEST May 27, 2024 5:56:29 PM CEST Success
Restore database: MCHTST May 27, 2024 5:56:29 PM CEST May 27, 2024 5:57:30 PM CEST Success
+-- Adding database to GI May 27, 2024 5:56:29 PM CEST May 27, 2024 5:56:30 PM CEST Success
+-- Adding database instance(s) to GI May 27, 2024 5:56:30 PM CEST May 27, 2024 5:56:30 PM CEST Success
+-- Modifying SPFILE for database May 27, 2024 5:56:30 PM CEST May 27, 2024 5:57:05 PM CEST Success
+-- Restore password file for database May 27, 2024 5:57:05 PM CEST May 27, 2024 5:57:05 PM CEST Skipped
+-- Start instance(s) for database May 27, 2024 5:57:05 PM CEST May 27, 2024 5:57:20 PM CEST Success
+-- Persist metadata for database May 27, 2024 5:57:20 PM CEST May 27, 2024 5:57:20 PM CEST Success
+-- Create adrci directory May 27, 2024 5:57:20 PM CEST May 27, 2024 5:57:21 PM CEST Success
+-- Run SqlPatch May 27, 2024 5:57:21 PM CEST May 27, 2024 5:57:30 PM CEST Success
Restore database: LV02TST May 27, 2024 5:57:30 PM CEST May 27, 2024 5:58:30 PM CEST Success
+-- Adding database to GI May 27, 2024 5:57:30 PM CEST May 27, 2024 5:57:32 PM CEST Success
+-- Adding database instance(s) to GI May 27, 2024 5:57:32 PM CEST May 27, 2024 5:57:32 PM CEST Success
+-- Modifying SPFILE for database May 27, 2024 5:57:32 PM CEST May 27, 2024 5:58:06 PM CEST Success
+-- Restore password file for database May 27, 2024 5:58:06 PM CEST May 27, 2024 5:58:06 PM CEST Skipped
+-- Start instance(s) for database May 27, 2024 5:58:06 PM CEST May 27, 2024 5:58:22 PM CEST Success
+-- Persist metadata for database May 27, 2024 5:58:22 PM CEST May 27, 2024 5:58:22 PM CEST Success
+-- Create adrci directory May 27, 2024 5:58:22 PM CEST May 27, 2024 5:58:22 PM CEST Success
+-- Run SqlPatch May 27, 2024 5:58:22 PM CEST May 27, 2024 5:58:30 PM CEST Success
Restore database: MCHBAC May 27, 2024 5:58:30 PM CEST May 27, 2024 5:59:41 PM CEST Success
+-- Adding database to GI May 27, 2024 5:58:30 PM CEST May 27, 2024 5:58:32 PM CEST Success
+-- Adding database instance(s) to GI May 27, 2024 5:58:32 PM CEST May 27, 2024 5:58:32 PM CEST Success
+-- Modifying SPFILE for database May 27, 2024 5:58:32 PM CEST May 27, 2024 5:59:07 PM CEST Success
+-- Restore password file for database May 27, 2024 5:59:07 PM CEST May 27, 2024 5:59:07 PM CEST Skipped
+-- Start instance(s) for database May 27, 2024 5:59:07 PM CEST May 27, 2024 5:59:23 PM CEST Success
+-- Persist metadata for database May 27, 2024 5:59:23 PM CEST May 27, 2024 5:59:23 PM CEST Success
+-- Create adrci directory May 27, 2024 5:59:24 PM CEST May 27, 2024 5:59:24 PM CEST Success
+-- Run SqlPatch May 27, 2024 5:59:24 PM CEST May 27, 2024 5:59:41 PM CEST Success
Restore database: BRRTST May 27, 2024 5:59:41 PM CEST May 27, 2024 6:01:24 PM CEST Success
+-- Adding database to GI May 27, 2024 5:59:41 PM CEST May 27, 2024 5:59:42 PM CEST Success
+-- Adding database instance(s) to GI May 27, 2024 5:59:42 PM CEST May 27, 2024 5:59:42 PM CEST Success
+-- Modifying SPFILE for database May 27, 2024 5:59:42 PM CEST May 27, 2024 6:00:16 PM CEST Success
+-- Restore password file for database May 27, 2024 6:00:16 PM CEST May 27, 2024 6:00:16 PM CEST Skipped
+-- Start instance(s) for database May 27, 2024 6:00:16 PM CEST May 27, 2024 6:00:38 PM CEST Success
+-- Persist metadata for database May 27, 2024 6:00:38 PM CEST May 27, 2024 6:00:38 PM CEST Success
+-- Create adrci directory May 27, 2024 6:00:38 PM CEST May 27, 2024 6:00:39 PM CEST Success
+-- Run SqlPatch May 27, 2024 6:00:39 PM CEST May 27, 2024 6:01:24 PM CEST Success
Restore database: LV01TST May 27, 2024 6:01:24 PM CEST May 27, 2024 6:02:40 PM CEST Success
+-- Adding database to GI May 27, 2024 6:01:24 PM CEST May 27, 2024 6:01:26 PM CEST Success
+-- Adding database instance(s) to GI May 27, 2024 6:01:26 PM CEST May 27, 2024 6:01:26 PM CEST Success
+-- Modifying SPFILE for database May 27, 2024 6:01:26 PM CEST May 27, 2024 6:02:01 PM CEST Success
+-- Restore password file for database May 27, 2024 6:02:01 PM CEST May 27, 2024 6:02:01 PM CEST Skipped
+-- Start instance(s) for database May 27, 2024 6:02:01 PM CEST May 27, 2024 6:02:18 PM CEST Success
+-- Persist metadata for database May 27, 2024 6:02:18 PM CEST May 27, 2024 6:02:18 PM CEST Success
+-- Create adrci directory May 27, 2024 6:02:18 PM CEST May 27, 2024 6:02:18 PM CEST Success
+-- Run SqlPatch May 27, 2024 6:02:18 PM CEST May 27, 2024 6:02:40 PM CEST Success
Restore database: DBTEST May 27, 2024 6:02:40 PM CEST May 27, 2024 6:03:59 PM CEST Success
+-- Adding database to GI May 27, 2024 6:02:40 PM CEST May 27, 2024 6:02:42 PM CEST Success
+-- Adding database instance(s) to GI May 27, 2024 6:02:42 PM CEST May 27, 2024 6:02:42 PM CEST Success
+-- Modifying SPFILE for database May 27, 2024 6:02:42 PM CEST May 27, 2024 6:03:17 PM CEST Success
+-- Restore password file for database May 27, 2024 6:03:17 PM CEST May 27, 2024 6:03:17 PM CEST Skipped
+-- Start instance(s) for database May 27, 2024 6:03:17 PM CEST May 27, 2024 6:03:34 PM CEST Success
+-- Persist metadata for database May 27, 2024 6:03:34 PM CEST May 27, 2024 6:03:34 PM CEST Success
+-- Create adrci directory May 27, 2024 6:03:35 PM CEST May 27, 2024 6:03:35 PM CEST Success
+-- Run SqlPatch May 27, 2024 6:03:35 PM CEST May 27, 2024 6:03:59 PM CEST Success
Restore database: KGED19TS May 27, 2024 6:03:59 PM CEST May 27, 2024 6:06:32 PM CEST Success
+-- Adding database to GI May 27, 2024 6:03:59 PM CEST May 27, 2024 6:04:02 PM CEST Success
+-- Adding database instance(s) to GI May 27, 2024 6:04:02 PM CEST May 27, 2024 6:04:02 PM CEST Success
+-- Modifying SPFILE for database May 27, 2024 6:04:02 PM CEST May 27, 2024 6:04:37 PM CEST Success
+-- Restore password file for database May 27, 2024 6:04:37 PM CEST May 27, 2024 6:04:38 PM CEST Skipped
+-- Start instance(s) for database May 27, 2024 6:04:38 PM CEST May 27, 2024 6:04:57 PM CEST Success
+-- Persist metadata for database May 27, 2024 6:04:58 PM CEST May 27, 2024 6:04:58 PM CEST Success
+-- Create adrci directory May 27, 2024 6:04:58 PM CEST May 27, 2024 6:04:58 PM CEST Success
+-- Run SqlPatch May 27, 2024 6:04:58 PM CEST May 27, 2024 6:06:32 PM CEST Success
Restore database: BRFTST May 27, 2024 6:06:32 PM CEST May 27, 2024 6:08:28 PM CEST Success
+-- Adding database to GI May 27, 2024 6:06:32 PM CEST May 27, 2024 6:06:34 PM CEST Success
+-- Adding database instance(s) to GI May 27, 2024 6:06:34 PM CEST May 27, 2024 6:06:34 PM CEST Success
+-- Modifying SPFILE for database May 27, 2024 6:06:35 PM CEST May 27, 2024 6:07:09 PM CEST Success
+-- Restore password file for database May 27, 2024 6:07:09 PM CEST May 27, 2024 6:07:09 PM CEST Skipped
+-- Start instance(s) for database May 27, 2024 6:07:09 PM CEST May 27, 2024 6:07:33 PM CEST Success
+-- Persist metadata for database May 27, 2024 6:07:33 PM CEST May 27, 2024 6:07:33 PM CEST Success
+-- Create adrci directory May 27, 2024 6:07:33 PM CEST May 27, 2024 6:07:33 PM CEST Success
+-- Run SqlPatch May 27, 2024 6:07:33 PM CEST May 27, 2024 6:08:28 PM CEST Success
Restore database: BRSLTST May 27, 2024 6:08:28 PM CEST May 27, 2024 6:10:16 PM CEST Success
+-- Adding database to GI May 27, 2024 6:08:28 PM CEST May 27, 2024 6:08:30 PM CEST Success
+-- Adding database instance(s) to GI May 27, 2024 6:08:31 PM CEST May 27, 2024 6:08:31 PM CEST Success
+-- Modifying SPFILE for database May 27, 2024 6:08:31 PM CEST May 27, 2024 6:09:05 PM CEST Success
+-- Restore password file for database May 27, 2024 6:09:05 PM CEST May 27, 2024 6:09:05 PM CEST Skipped
+-- Start instance(s) for database May 27, 2024 6:09:05 PM CEST May 27, 2024 6:09:27 PM CEST Success
+-- Persist metadata for database May 27, 2024 6:09:27 PM CEST May 27, 2024 6:09:27 PM CEST Success
+-- Create adrci directory May 27, 2024 6:09:27 PM CEST May 27, 2024 6:09:27 PM CEST Success
+-- Run SqlPatch May 27, 2024 6:09:27 PM CEST May 27, 2024 6:10:16 PM CEST Success
Restore database: BRCLATST May 27, 2024 6:10:16 PM CEST May 27, 2024 6:12:13 PM CEST Success
+-- Adding database to GI May 27, 2024 6:10:17 PM CEST May 27, 2024 6:10:18 PM CEST Success
+-- Adding database instance(s) to GI May 27, 2024 6:10:18 PM CEST May 27, 2024 6:10:18 PM CEST Success
+-- Modifying SPFILE for database May 27, 2024 6:10:19 PM CEST May 27, 2024 6:10:53 PM CEST Success
+-- Restore password file for database May 27, 2024 6:10:54 PM CEST May 27, 2024 6:10:54 PM CEST Skipped
+-- Start instance(s) for database May 27, 2024 6:10:54 PM CEST May 27, 2024 6:11:16 PM CEST Success
+-- Persist metadata for database May 27, 2024 6:11:16 PM CEST May 27, 2024 6:11:16 PM CEST Success
+-- Create adrci directory May 27, 2024 6:11:16 PM CEST May 27, 2024 6:11:16 PM CEST Success
+-- Run SqlPatch May 27, 2024 6:11:16 PM CEST May 27, 2024 6:12:13 PM CEST Success
Restore Object Stores May 27, 2024 6:12:13 PM CEST May 27, 2024 6:12:13 PM CEST Success
Remount NFS backups May 27, 2024 6:12:13 PM CEST May 27, 2024 6:12:13 PM CEST Success
Restore BackupConfigs May 27, 2024 6:12:13 PM CEST May 27, 2024 6:12:13 PM CEST Success
Reattach backupconfigs to DBs May 27, 2024 6:12:13 PM CEST May 27, 2024 6:12:13 PM CEST Success
Restore backup reports May 27, 2024 6:12:13 PM CEST May 27, 2024 6:12:13 PM CEST SuccessOur 12cR1 databases are restored without any problem, as well as 19c ones.
Next steps when using DPRYour 12.1 databases will never get another update, but it does not apply to 19c databases. Using DPR will not update your 19.18 databases to 19.22: you need to apply classic patching method to update them. Download the 19.22 DB clone, register this clone into the ODA repository and do the prepatch report on your first 19c DB home. Then patch the DB home to 19.22:
odacli update-repository -f /backup/patch/19_22/DB/odacli-dcs-19.22.0.0.0-240306-DB-19.22.0.0.zip
...

odacli create-prepatchreport -d -i 84cb4f9a-7c45-432b-9e4a-c58f2fe53ca0 -v 19.22.0.0.0
...

odacli describe-prepatchreport -i a9811a90-0f62-4648-86e5-c9a5adaf1be5
...

odacli update-dbhome -i 84cb4f9a-7c45-432b-9e4a-c58f2fe53ca0 -v 19.22.0.0.0 -f
...
As all databases from this 19.18 are now linked to a new 19.22 DB home, the old DB home is not needed anymore, let’s remove it:
odacli delete-dbhome -i 84cb4f9a-7c45-432b-9e4a-c58f2fe53ca0

odacli describe-job -i 814d1792-95a6-4592-90b5-42d0b271917b
...

odacli list-dbhomes
ID                                       Name                 DB Version           DB Edition Home Location                                            Status
---------------------------------------- -------------------- -------------------- ---------- -------------------------------------------------------- ----------
da2a5bef-9e79-49e2-b811-b7a8b9283bd9     OraDB12102_home3     12.1.0.2.220719      EE         /u01/app/odaorahome/oracle/product/12.1.0.2/dbhome_3     CONFIGURED
f221039f-1430-488e-b853-e3a3fc518020     OraDB19000_home3     19.22.0.0.240116     EE         /u01/app/odaorahome/oracle/product/19.0.0.0/dbhome_3     CONFIGURED
If you have multiple 19c DB homes, you will need to repeat this update for each DB home.
If your ODA is also running VMs and/or DB Systems, you will need to do a restore-node -kvm then a restore-node -dbs.
ConclusionKeeping 12cR1 is still possible when upgrading to 19.21 or later, but you should know that it’s because there is no reason for Oracle to remove your existing DB homes and databases. For a fresh setup without using DPR, I would recommend putting old DB homes and databases inside a VM. Unlike DB Systems, VM content is not managed by odacli, therefore you can use whatever OS and whatever Oracle release you need. Without any support of any kind, for sure.
L’article Is DPR compatible with 12.1 databases running on your ODA? est apparu en premier sur dbi Blog.
CloudNativePG – Scaling up and down
By now, if you followed the previous posts (here, here, here, here and here), we know quite a bit about how to use CloudNativePG to deploy a PostgreSQL cluster and how to get detailed information about the deployment. What we’ll look at in this post is how you can leverage this deployment to scale the cluster up and down. This might be important if you have changing workloads throughout the day or the week and your application is able to distribute read only workloads across the PostgreSQL replicas.
When we look at what we have now, we do see this:
minicube@micro-minicube:~> kubectl-cnpg status my-pg-cluster
Cluster Summary
Name:                my-pg-cluster
Namespace:           default
System ID:           7378131726640287762
PostgreSQL Image:    ghcr.io/cloudnative-pg/postgresql:16.2
Primary instance:    my-pg-cluster-1
Primary start time:  2024-06-08 13:59:26 +0000 UTC (uptime 88h35m7s)
Status:              Cluster in healthy state
Instances:           3
Ready instances:     3
Current Write LSN:   0/26000000 (Timeline: 1 - WAL File: 000000010000000000000012)

Certificates Status
Certificate Name           Expiration Date                Days Left Until Expiration
----------------           ---------------                --------------------------
my-pg-cluster-ca           2024-09-06 13:54:17 +0000 UTC  86.31
my-pg-cluster-replication  2024-09-06 13:54:17 +0000 UTC  86.31
my-pg-cluster-server       2024-09-06 13:54:17 +0000 UTC  86.31

Continuous Backup status
Not configured

Physical backups
No running physical backups found

Streaming Replication status
Replication Slots Enabled
Name             Sent LSN    Write LSN   Flush LSN   Replay LSN  Write Lag  Flush Lag  Replay Lag  State      Sync State  Sync Priority  Replication Slot
----             --------    ---------   ---------   ----------  ---------  ---------  ----------  -----      ----------  -------------  ----------------
my-pg-cluster-2  0/26000000  0/26000000  0/26000000  0/26000000  00:00:00   00:00:00   00:00:00    streaming  async       0              active
my-pg-cluster-3  0/26000000  0/26000000  0/26000000  0/26000000  00:00:00   00:00:00   00:00:00    streaming  async       0              active

Unmanaged Replication Slot Status
No unmanaged replication slots found

Managed roles status
No roles managed

Tablespaces status
No managed tablespaces

Pod Disruption Budgets status
Name                   Role     Expected Pods  Current Healthy  Minimum Desired Healthy  Disruptions Allowed
----                   ----     -------------  ---------------  -----------------------  -------------------
my-pg-cluster          replica  2              2                1                        1
my-pg-cluster-primary  primary  1              1                1                        0

Instances status
Name             Database Size  Current LSN  Replication role  Status  QoS         Manager Version  Node
----             -------------  -----------  ----------------  ------  ---         ---------------  ----
my-pg-cluster-1  37 MB          0/26000000   Primary           OK      BestEffort  1.23.1           minikube
my-pg-cluster-2  37 MB          0/26000000   Standby (async)   OK      BestEffort  1.23.1           minikube
my-pg-cluster-3  37 MB          0/26000000   Standby (async)   OK      BestEffort  1.23.1           minikube
We have a primary instance running in pod my-pg-cluster-1, and we have two replicas in asynchronous mode running in pods my-pg-cluster-2 and my-pg-cluster-3. Let’s assume we have an increasing workload and we want to have two more replicas. There are two ways in which you can do this. The first one is to change the configuration of the cluster in the yaml and then re-apply the configuration. This is the configuration as it is now:
apiVersion: postgresql.cnpg.io/v1
kind: Cluster
metadata:
  name: my-pg-cluster
spec:
  instances: 3

  bootstrap:
    initdb:
      database: db1
      owner: db1
      dataChecksums: true
      walSegmentSize: 32
      localeCollate: 'en_US.utf8'
      localeCType: 'en_US.utf8'
      postInitSQL:
      - create user db2
      - create database db2 with owner = db2

  postgresql:
    parameters:
      work_mem: "12MB"
      pg_stat_statements.max: "2500"
    pg_hba:
      - host all all 192.168.122.0/24 scram-sha-256

  storage:
    size: 1Gi
All we need to do is to change the number of instances we want to have. With the current value of three, we get one primary and two replicas. If we want to have two more replicas, change this to five and re-apply:
minicube@micro-minicube:~> grep instances pg.yaml
  instances: 5
minicube@micro-minicube:~> kubectl apply -f pg.yaml
cluster.postgresql.cnpg.io/my-pg-cluster configured
By monitoring the pods you can follow the progress of bringing up two new pods and attaching the replicas to the current cluster:
minicube@micro-minicube:~> kubectl get pods
NAME                         READY   STATUS            RESTARTS      AGE
my-pg-cluster-1              1/1     Running           1 (32m ago)   2d1h
my-pg-cluster-2              1/1     Running           1 (32m ago)   2d
my-pg-cluster-3              1/1     Running           1 (32m ago)   2d
my-pg-cluster-4              0/1     PodInitializing   0             3s
my-pg-cluster-4-join-kqgwp   0/1     Completed         0             11s
minicube@micro-minicube:~> kubectl get pods
NAME              READY   STATUS    RESTARTS      AGE
my-pg-cluster-1   1/1     Running   1 (33m ago)   2d1h
my-pg-cluster-2   1/1     Running   1 (33m ago)   2d
my-pg-cluster-3   1/1     Running   1 (33m ago)   2d
my-pg-cluster-4   1/1     Running   0             42s
my-pg-cluster-5   1/1     Running   0             19s
Now we see five pods, as requested, and looking at the PostgreSQL streaming replication configuration confirms that we now have four replicas:
minicube@micro-minicube:~> kubectl-cnpg status my-pg-cluster
Cluster Summary
Name:                my-pg-cluster
Namespace:           default
System ID:           7378131726640287762
PostgreSQL Image:    ghcr.io/cloudnative-pg/postgresql:16.2
Primary instance:    my-pg-cluster-1
Primary start time:  2024-06-08 13:59:26 +0000 UTC (uptime 88h43m54s)
Status:              Cluster in healthy state
Instances:           5
Ready instances:     5
Current Write LSN:   0/2C000060 (Timeline: 1 - WAL File: 000000010000000000000016)

Certificates Status
Certificate Name           Expiration Date                Days Left Until Expiration
----------------           ---------------                --------------------------
my-pg-cluster-ca           2024-09-06 13:54:17 +0000 UTC  86.30
my-pg-cluster-replication  2024-09-06 13:54:17 +0000 UTC  86.30
my-pg-cluster-server       2024-09-06 13:54:17 +0000 UTC  86.30

Continuous Backup status
Not configured

Physical backups
No running physical backups found

Streaming Replication status
Replication Slots Enabled
Name             Sent LSN    Write LSN   Flush LSN   Replay LSN  Write Lag  Flush Lag  Replay Lag  State      Sync State  Sync Priority  Replication Slot
----             --------    ---------   ---------   ----------  ---------  ---------  ----------  -----      ----------  -------------  ----------------
my-pg-cluster-2  0/2C000060  0/2C000060  0/2C000060  0/2C000060  00:00:00   00:00:00   00:00:00    streaming  async       0              active
my-pg-cluster-3  0/2C000060  0/2C000060  0/2C000060  0/2C000060  00:00:00   00:00:00   00:00:00    streaming  async       0              active
my-pg-cluster-4  0/2C000060  0/2C000060  0/2C000060  0/2C000060  00:00:00   00:00:00   00:00:00    streaming  async       0              active
my-pg-cluster-5  0/2C000060  0/2C000060  0/2C000060  0/2C000060  00:00:00   00:00:00   00:00:00    streaming  async       0              active

Unmanaged Replication Slot Status
No unmanaged replication slots found

Managed roles status
No roles managed

Tablespaces status
No managed tablespaces

Pod Disruption Budgets status
Name                   Role     Expected Pods  Current Healthy  Minimum Desired Healthy  Disruptions Allowed
----                   ----     -------------  ---------------  -----------------------  -------------------
my-pg-cluster          replica  4              4                3                        1
my-pg-cluster-primary  primary  1              1                1                        0

Instances status
Name             Database Size  Current LSN  Replication role  Status  QoS         Manager Version  Node
----             -------------  -----------  ----------------  ------  ---         ---------------  ----
my-pg-cluster-1  37 MB          0/2C000060   Primary           OK      BestEffort  1.23.1           minikube
my-pg-cluster-2  37 MB          0/2C000060   Standby (async)   OK      BestEffort  1.23.1           minikube
my-pg-cluster-3  37 MB          0/2C000060   Standby (async)   OK      BestEffort  1.23.1           minikube
my-pg-cluster-4  37 MB          0/2C000060   Standby (async)   OK      BestEffort  1.23.1           minikube
my-pg-cluster-5  37 MB          0/2C000060   Standby (async)   OK      BestEffort  1.23.1           minikube
If you want to scale this down again (maybe because the workload decreased), you can do that in the same way by reducing the number of instances from five to three in the cluster definition, or by directly scaling the cluster down with kubectl:
minicube@micro-minicube:~> kubectl scale --replicas=2 -f pg.yaml
cluster.postgresql.cnpg.io/my-pg-cluster scaled
Attention: Replicas in this context does not mean streaming replication replicas. It means replicas in the context of Kubernetes, so if you do it like above, the result will be one primary and one replica:
minicube@micro-minicube:~> kubectl get pods
NAME              READY   STATUS    RESTARTS      AGE
my-pg-cluster-1   1/1     Running   1 (39m ago)   2d1h
my-pg-cluster-2   1/1     Running   1 (39m ago)   2d1h
What you probably really want is this (to get back to the initial state of the cluster):
minicube@micro-minicube:~> kubectl scale --replicas=3 -f pg.yaml
cluster.postgresql.cnpg.io/my-pg-cluster scaled
minicube@micro-minicube:~> kubectl get pods
NAME                         READY   STATUS    RESTARTS      AGE
my-pg-cluster-1              1/1     Running   1 (41m ago)   2d1h
my-pg-cluster-2              1/1     Running   1 (41m ago)   2d1h
my-pg-cluster-6-join-747nx   0/1     Pending   0             1s
minicube@micro-minicube:~> kubectl get pods
NAME                         READY   STATUS    RESTARTS      AGE
my-pg-cluster-1              1/1     Running   1 (41m ago)   2d1h
my-pg-cluster-2              1/1     Running   1 (41m ago)   2d1h
my-pg-cluster-6-join-747nx   1/1     Running   0             5s
minicube@micro-minicube:~> kubectl get pods
NAME                         READY   STATUS      RESTARTS      AGE
my-pg-cluster-1              1/1     Running     1 (42m ago)   2d1h
my-pg-cluster-2              1/1     Running     1 (42m ago)   2d1h
my-pg-cluster-6              0/1     Running     0             5s
my-pg-cluster-6-join-747nx   0/1     Completed   0             14s
...
minicube@micro-minicube:~> kubectl get pods
NAME              READY   STATUS    RESTARTS      AGE
my-pg-cluster-1   1/1     Running   1 (42m ago)   2d1h
my-pg-cluster-2   1/1     Running   1 (42m ago)   2d1h
my-pg-cluster-6   1/1     Running   0             16s
What you shouldn’t do is to mix both ways of scaling, for one reason: If you scale up or down by using “kubectl scale”, this will not modify your cluster configuration file. There we still have five instances:
minicube@micro-minicube:~> grep instances pg.yaml
  instances: 5
Our recommendation is, to do this only by modifying the configuration and re-apply afterwards. This ensures, that you always have the “reality” in the configuration file, and not a mix of live state and desired state.
In the next we’ll look into storage, because you want your databases to be persistent and fast.
L’article CloudNativePG – Scaling up and down est apparu en premier sur dbi Blog.
CloudNativePG – The kubectl plugin
As we’re getting more and more familiar with CloudNativePG, now it’s time to get more information about our cluster, either for monitoring or troubleshooting purposes. Getting information about the general state of our cluster can be easily done by using kubectl.
For listing the global state of our cluster, you can do:
minicube@micro-minicube:~> kubectl get cluster -A
NAMESPACE   NAME            AGE   INSTANCES   READY   STATUS                     PRIMARY
default     my-pg-cluster   41h   3           3       Cluster in healthy state   my-pg-cluster-1
As we’ve seen in the previous posts (here, here, here and here) kubectl can also be used to get information about the pods and services of the deployment:
minicube@micro-minicube:~> kubectl get pods
NAME              READY   STATUS    RESTARTS   AGE
my-pg-cluster-1   1/1     Running   0          108m
my-pg-cluster-2   1/1     Running   0          103m
my-pg-cluster-3   1/1     Running   0          103m
minicube@micro-minicube:~> kubectl get services
NAME               TYPE        CLUSTER-IP       EXTERNAL-IP   PORT(S)    AGE
kubernetes         ClusterIP   10.96.0.1        <none>        443/TCP    4d
my-pg-cluster-r    ClusterIP   10.111.113.4     <none>        5432/TCP   41h
my-pg-cluster-ro   ClusterIP   10.110.137.246   <none>        5432/TCP   41h
my-pg-cluster-rw   ClusterIP   10.100.77.15     <none>        5432/TCP   41h
What we cannot see easily with kubectl is information related to PostgreSQL itself. But as kubectl can be extended with plugins, CloudNativePG comes with a plugin for kubectl which is called “cnpg“. There are several installation methods available, we’ll go for the scripted version:
minicube@micro-minicube:~> curl -sSfL https://github.com/cloudnative-pg/cloudnative-pg/raw/main/hack/install-cnpg-plugin.sh | sudo sh -s -- -b /usr/local/bin
cloudnative-pg/cloudnative-pg info checking GitHub for latest tag
cloudnative-pg/cloudnative-pg info found version: 1.23.1 for v1.23.1/linux/x86_64
cloudnative-pg/cloudnative-pg info installed /usr/local/bin/kubectl-cnpg
A very nice feature of this plugin is, that it comes with support for auto completion of the available commands, but this needs to be configured before you can use it. You can use the plugin itself to generate the completion script for one of the supported shells (bash in my case):
minicube@micro-minicube:~> kubectl cnpg completion
Generate the autocompletion script for kubectl-cnpg for the specified shell.
See each sub-command's help for details on how to use the generated script.

Usage:
  kubectl cnpg completion [command]

Available Commands:
  bash        Generate the autocompletion script for bash
  fish        Generate the autocompletion script for fish
  powershell  Generate the autocompletion script for powershell
  zsh         Generate the autocompletion script for zsh

...
minicube@micro-minicube:~> kubectl cnpg completion bash > kubectl_complete-cnpg
minicube@micro-minicube:~> chmod +x kubectl_complete-cnpg
minicube@micro-minicube:~> sudo mv kubectl_complete-cnpg /usr/local/bin/
From now, tab completion is working:
minicube@micro-minicube:~> kubectl-cnpg [TAB][TAB]
backup        (Request an on-demand backup for a PostgreSQL Cluster)
certificate   (Create a client certificate to connect to PostgreSQL using TLS and Certificate authentication)
completion    (Generate the autocompletion script for the specified shell)
destroy       (Destroy the instance named [cluster]-[node] or [node] with the associated PVC)
fencing       (Fencing related commands)
fio           (Creates a fio deployment, pvc and configmap)
help          (Help about any command)
hibernate     (Hibernation related commands)
install       (CNPG installation commands)
logs          (Collect cluster logs)
maintenance   (Sets or removes maintenance mode from clusters)
pgadmin4      (Creates a pgadmin deployment)
pgbench       (Creates a pgbench job)
promote       (Promote the pod named [cluster]-[node] or [node] to primary)
psql          (Start a psql session targeting a CloudNativePG cluster)
publication   (Logical publication management commands)
reload        (Reload the cluster)
report        (Report on the operator)
restart       (Restart a cluster or a single instance in a cluster)
snapshot      (command removed)
status        (Get the status of a PostgreSQL cluster)
subscription  (Logical subscription management commands)
version       (Prints version, commit sha and date of the build)
As you can see, quite a few commands are available, but for the scope of this post, we’ll only use the commands for getting logs and detailed information about our cluster. Obviously the “status” command should give us some global information about the cluster, and actually it will give us much more:
minicube@micro-minicube:~> kubectl-cnpg status my-pg-cluster
Cluster Summary
Name:                my-pg-cluster
Namespace:           default
System ID:           7378131726640287762
PostgreSQL Image:    ghcr.io/cloudnative-pg/postgresql:16.2
Primary instance:    my-pg-cluster-1
Primary start time:  2024-06-08 13:59:26 +0000 UTC (uptime 42h49m23s)
Status:              Cluster in healthy state
Instances:           3
Ready instances:     3
Current Write LSN:   0/1E000000 (Timeline: 1 - WAL File: 00000001000000000000000E)

Certificates Status
Certificate Name           Expiration Date                Days Left Until Expiration
----------------           ---------------                --------------------------
my-pg-cluster-ca           2024-09-06 13:54:17 +0000 UTC  88.21
my-pg-cluster-replication  2024-09-06 13:54:17 +0000 UTC  88.21
my-pg-cluster-server       2024-09-06 13:54:17 +0000 UTC  88.21

Continuous Backup status
Not configured

Physical backups
No running physical backups found

Streaming Replication status
Replication Slots Enabled
Name             Sent LSN    Write LSN   Flush LSN   Replay LSN  Write Lag  Flush Lag  Replay Lag  State      Sync State  Sync Priority  Replication Slot
----             --------    ---------   ---------   ----------  ---------  ---------  ----------  -----      ----------  -------------  ----------------
my-pg-cluster-2  0/1E000000  0/1E000000  0/1E000000  0/1E000000  00:00:00   00:00:00   00:00:00    streaming  async       0              active
my-pg-cluster-3  0/1E000000  0/1E000000  0/1E000000  0/1E000000  00:00:00   00:00:00   00:00:00    streaming  async       0              active

Unmanaged Replication Slot Status
No unmanaged replication slots found

Managed roles status
No roles managed

Tablespaces status
No managed tablespaces

Pod Disruption Budgets status
Name                   Role     Expected Pods  Current Healthy  Minimum Desired Healthy  Disruptions Allowed
----                   ----     -------------  ---------------  -----------------------  -------------------
my-pg-cluster          replica  2              2                1                        1
my-pg-cluster-primary  primary  1              1                1                        0

Instances status
Name             Database Size  Current LSN  Replication role  Status  QoS         Manager Version  Node
----             -------------  -----------  ----------------  ------  ---         ---------------  ----
my-pg-cluster-1  37 MB          0/1E000000   Primary           OK      BestEffort  1.23.1           minikube
my-pg-cluster-2  37 MB          0/1E000000   Standby (async)   OK      BestEffort  1.23.1           minikube
my-pg-cluster-3  37 MB          0/1E000000   Standby (async)   OK      BestEffort  1.23.1           minikube
This is quite some amount of information and tells us a lot about our cluster, including:
- We have one primary node and two replicas in asynchronous replication (this comes from the three instances we specified in the cluster configuration)
- All instances are healthy and there is no replication lag
- The version of PostgreSQL is 16.2
- The configuration is using replication slots
- Information about the certificates used for encrypted traffic
- We do not have configured any backups (this will be the topic of one of the next posts)
If you want too see even more information, including e.g. the configuration of PostgreSQL, pass the “–verbose” flag to the status command:
minicube@micro-minicube:~> kubectl-cnpg status my-pg-cluster --verbose
Cluster Summary
Name:                my-pg-cluster
Namespace:           default
System ID:           7378131726640287762
PostgreSQL Image:    ghcr.io/cloudnative-pg/postgresql:16.2
Primary instance:    my-pg-cluster-1
Primary start time:  2024-06-08 13:59:26 +0000 UTC (uptime 42h57m30s)
Status:              Cluster in healthy state
Instances:           3
Ready instances:     3
Current Write LSN:   0/20000110 (Timeline: 1 - WAL File: 000000010000000000000010)

PostgreSQL Configuration
archive_command = '/controller/manager wal-archive --log-destination /controller/log/postgres.json %p'
archive_mode = 'on'
archive_timeout = '5min'
cluster_name = 'my-pg-cluster'
dynamic_shared_memory_type = 'posix'
full_page_writes = 'on'
hot_standby = 'true'
listen_addresses = '*'
log_destination = 'csvlog'
log_directory = '/controller/log'
log_filename = 'postgres'
log_rotation_age = '0'
log_rotation_size = '0'
log_truncate_on_rotation = 'false'
logging_collector = 'on'
max_parallel_workers = '32'
max_replication_slots = '32'
max_worker_processes = '32'
pg_stat_statements.max = '2500'
port = '5432'
restart_after_crash = 'false'
shared_memory_type = 'mmap'
shared_preload_libraries = 'pg_stat_statements'
ssl = 'on'
ssl_ca_file = '/controller/certificates/client-ca.crt'
ssl_cert_file = '/controller/certificates/server.crt'
ssl_key_file = '/controller/certificates/server.key'
ssl_max_protocol_version = 'TLSv1.3'
ssl_min_protocol_version = 'TLSv1.3'
unix_socket_directories = '/controller/run'
wal_keep_size = '512MB'
wal_level = 'logical'
wal_log_hints = 'on'
wal_receiver_timeout = '5s'
wal_sender_timeout = '5s'
work_mem = '12MB'
cnpg.config_sha256 = 'db8a255b574978eb43a479ec688a1e8e72281ec3fa03b59bcb3cf3bf9b997e67'

PostgreSQL HBA Rules

#
# FIXED RULES
#

# Grant local access ('local' user map)
local all all peer map=local

# Require client certificate authentication for the streaming_replica user
hostssl postgres streaming_replica all cert
hostssl replication streaming_replica all cert
hostssl all cnpg_pooler_pgbouncer all cert

#
# USER-DEFINED RULES
#


host all all 192.168.122.0/24 scram-sha-256


#
# DEFAULT RULES
#
host all all all scram-sha-256


Certificates Status
Certificate Name           Expiration Date                Days Left Until Expiration
----------------           ---------------                --------------------------
my-pg-cluster-ca           2024-09-06 13:54:17 +0000 UTC  88.21
my-pg-cluster-replication  2024-09-06 13:54:17 +0000 UTC  88.21
my-pg-cluster-server       2024-09-06 13:54:17 +0000 UTC  88.21

Continuous Backup status
Not configured

Physical backups
No running physical backups found

Streaming Replication status
Replication Slots Enabled
Name             Sent LSN    Write LSN   Flush LSN   Replay LSN  Write Lag  Flush Lag  Replay Lag  State      Sync State  Sync Priority  Replication Slot  Slot Restart LSN  Slot WAL Status  Slot Safe WAL Size
----             --------    ---------   ---------   ----------  ---------  ---------  ----------  -----      ----------  -------------  ----------------  ----------------  ---------------  ------------------
my-pg-cluster-2  0/20000110  0/20000110  0/20000110  0/20000110  00:00:00   00:00:00   00:00:00    streaming  async       0              active            0/20000110        reserved         NULL
my-pg-cluster-3  0/20000110  0/20000110  0/20000110  0/20000110  00:00:00   00:00:00   00:00:00    streaming  async       0              active            0/20000110        reserved         NULL

Unmanaged Replication Slot Status
No unmanaged replication slots found

Managed roles status
No roles managed

Tablespaces status
No managed tablespaces

Pod Disruption Budgets status
Name                   Role     Expected Pods  Current Healthy  Minimum Desired Healthy  Disruptions Allowed
----                   ----     -------------  ---------------  -----------------------  -------------------
my-pg-cluster          replica  2              2                1                        1
my-pg-cluster-primary  primary  1              1                1                        0

Instances status
Name             Database Size  Current LSN  Replication role  Status  QoS         Manager Version  Node
----             -------------  -----------  ----------------  ------  ---         ---------------  ----
my-pg-cluster-1  37 MB          0/20000110   Primary           OK      BestEffort  1.23.1           minikube
my-pg-cluster-2  37 MB          0/20000110   Standby (async)   OK      BestEffort  1.23.1           minikube
my-pg-cluster-3  37 MB          0/20000110   Standby (async)   OK      BestEffort  1.23.1           minikube
The other important command when it comes to troubleshooting is the “logs” command (the “-f” is for tail):
minicube@micro-minicube:~> kubectl-cnpg logs cluster my-pg-cluster -f
...
{"level":"info","ts":"2024-06-10T08:51:59Z","logger":"wal-archive","msg":"Backup not configured, skip WAL archiving via Barman Cloud","logging_pod":"my-pg-cluster-1","walName":"pg_wal/00000001000000000000000F","currentPrimary":"my-pg-cluster-1","targetPrimary":"my-pg-cluster-1"}
{"level":"info","ts":"2024-06-10T08:52:00Z","logger":"postgres","msg":"record","logging_pod":"my-pg-cluster-1","record":{"log_time":"2024-06-10 08:52:00.121 UTC","process_id":"1289","session_id":"66669223.509","session_line_num":"4","session_start_time":"2024-06-10 05:41:55 UTC","transaction_id":"0","error_severity":"LOG","sql_state_code":"00000","message":"checkpoint complete: wrote 10 buffers (0.1%); 0 WAL file(s) added, 0 removed, 0 recycled; write=1.005 s, sync=0.006 s, total=1.111 s; sync files=5, longest=0.002 s, average=0.002 s; distance=64233 kB, estimate=64233 kB; lsn=0/20000060, redo lsn=0/1E006030","backend_type":"checkpointer","query_id":"0"}}
{"level":"info","ts":"2024-06-10T08:56:59Z","logger":"wal-archive","msg":"Backup not configured, skip WAL archiving via Barman Cloud","logging_pod":"my-pg-cluster-1","walName":"pg_wal/000000010000000000000010","currentPrimary":"my-pg-cluster-1","targetPrimary":"my-pg-cluster-1"}
This gives you the PostgreSQL as well as the operator logs. Both, the “status” and the “logs” command are essential for troubleshooting.
In the next post we’ll look at scaling the cluster up and down.
L’article CloudNativePG – The kubectl plugin est apparu en premier sur dbi Blog.
How to Fix the etcd Error: “etcdserver: mvcc: database space exceeded” in a Patroni cluster
If you’re encountering the etcd error “etcdserver: mvcc: database space exceeded,” it means your etcd database has exceeded its storage limit. This can occur due to a variety of reasons, such as a large number of revisions or excessive data accumulation. However, there’s no need to panic; this issue can be resolved effectively.
I know that there is already plenty of blogs or posts about etcd, but 99% of them are related to Kubernetes topic where etcd is managed in containers. In my case, etcd cluster is installed on three SLES VMs alongside a Patroni cluster. Using etcd with Patroni enhances the reliability, scalability, and manageability of PostgreSQL clusters by providing a robust distributed coordination mechanism for high availability and configuration management. So dear DBA, I hope that this blog will help you ! Below, I’ll outline the steps to fix this error and prevent this error from happening.
Where did this issue happenThe first time I saw this issue was at a customer. They had a Patroni cluster with 3 nodes, including 2 PostgreSQL instance. They noticed Patroni issue on their monitoring so I was asked to have a look. In the end, the Patroni issue was caused by the etcd database being full. I find the error logs from the etcd service status.
Understanding the ErrorBefore diving into the solution, it’s essential to understand what causes this error. Etcd, a distributed key-value store, utilizes a Multi-Version Concurrency Control (MVCC) model to manage data. When the database space is exceeded, it indicates that there’s too much data stored, potentially leading to performance issues or even service disruptions. By default, the database size is limited to 2Gb, which should be more than enough, but without knowing this limitation, you might encounter the same issue than me one day.
Pause Patroni Cluster ManagementUtilize Patroni’s patronictl command to temporarily suspend cluster management, effectively halting automated failover processes and configuration adjustments while conducting the fix procedure. (https://patroni.readthedocs.io/en/latest/pause.html)
# patronictl pause --wait
'pause' request sent, waiting until it is recognized by all nodes
Success: cluster management is pausedThe first step is to adjust the etcd configuration file to optimize database space usage. Add the following parameters to your etcd configuration file on all nodes of the cluster.
max-wals: 2
auto-compaction-mode: periodic
auto-compaction-retention: "36h"
Below, I’ll provide you with some explanation concerning the three parameters we are adding to the configuration file:
- max-wals: 2:
- This parameter specifies the maximum number of write-ahead logs (WALs) that etcd should retain before compacting them. WALs are temporary files used to store recent transactions before they are written to the main etcd database.
- By limiting the number of WALs retained, you control the amount of temporary data stored, which helps in managing disk space usage. Keeping a low number of WALs ensures that disk space is not consumed excessively by temporary transaction logs.
- auto-compaction-mode: periodic:
- This parameter determines the mode of automatic database compaction. When set to “periodic,” etcd automatically compacts its database periodically based on the configured retention period.
- Database compaction removes redundant or obsolete data, reclaiming disk space and preventing the database from growing indefinitely. Periodic compaction ensures that old data is regularly cleaned up, maintaining optimal performance and disk space usage.
- auto-compaction-retention: “36h”:
- This parameter defines the retention period for data before it becomes eligible for automatic compaction. It specifies the duration after which etcd should consider data for compaction.
- In this example, “36h” represents a retention period of 36 hours. Any data older than 36 hours is eligible for compaction during the next periodic compaction cycle.
- Adjusting the retention period allows you to control how long historical data is retained in the etcd database. Shorter retention periods result in more frequent compaction and potentially smaller database sizes, while longer retention periods preserve historical data for a longer duration.
Ensure to restart the etcd service on each node after updating the configuration. You can restart the nodes one by one and monitor the cluster’s status between each restart.
Remove Excessive Data and Defragment the DatabaseExecute various etcd commands to remove excessive data from the etcd database and defragment it. These commands need to be run on each etcd nodes. Complete the whole procedure node by node. In our case, I suggest that we start the process on our third nodes, where we don’t have any PostgreSQL instance running.
# Obtain the current revision
$ rev=$(ETCDCTL_API=3 etcdctl --endpoints=<your-endpoints> endpoint status --write-out="json" | grep -o '"revision":[0-9]*' | grep -o '[0-9].*')

# Compact all old revisions
$ ETCDCTL_API=3 etcdctl compact $rev

# Defragment the excessive space (execute for each etcd node)
$ ETCDCTL_API=3 etcdctl defrag --endpoints=<your-endpoints>

# Disarm alarm
$ ETCDCTL_API=3 etcdctl alarm disarm

# Check the cluster's status again
$ etcdctl endpoint status --cluster -w table
- if the $rev variable contains three times the same number, only use one instance of the number
- The first time you run the compact/defrag commands, you may receive an etcd error. To be on the safe side, run the command on the third node first. In case of an error, you may need to restart the etcd service on the node before continuing. From a blog, this potential error might only concerned etcd version 3.5.x : “There is a known issue that etcd might run into data inconsistency issue if it crashes in the middle of an online defragmentation operation using
etcdctlor clientv3 API. All the existing v3.5 releases are affected, including 3.5.0 ~ 3.5.5. So please useetcdutlto offline perform defragmentation operation, but this requires taking each member offline one at a time. It means that you need to stop each etcd instance firstly, then perform defragmentation usingetcdutl, start the instance at last. Please refer to the issue 1 in public statement.” (https://etcd.io/blog/2023/how_to_debug_large_db_size_issue/#:~:text=Users%20can%20configure%20the%20quota,sufficient%20for%20most%20use%20cases) - Run the defrag command for each node and verify that the DB size has properly reduce each time.
After completing the steps above, ensure there are no more alarms, and the database size has reduced. Monitor the cluster’s performance to confirm that the issue has been resolved successfully.
Resume Patroni Cluster ManagementAfter confirming the successful clean of the alarms, proceed to re-enable cluster management, enabling Patroni to resume its standard operations and exit maintenance mode.
# patronictl resume --wait
'resume' request sent, waiting until it is recognized by all nodes
Success: cluster management is resumedTo conclude, facing the “etcdserver: mvcc: database space exceeded” error can be concerning, but with the right approach, it’s entirely manageable. By updating the etcd configuration and executing appropriate commands to remove excess data and defragment the database, you can optimize your etcd cluster’s performance and ensure smooth operation. Remember to monitor the cluster regularly to catch any potential issues early on. With these steps, you can effectively resolve the etcd database space exceeded error and maintain a healthy etcd environment.
Useful LinksFind more information about etcd database size: How to debug large db size issue?https://etcd.io/blog/2023/how_to_debug_large_db_size_issue/#:~:text=Users%20can%20configure%20the%20quota,sufficient%20for%20most%20use%20cases.
Official etcd operations guide: https://etcd.io/docs/v3.5/op-guide/
L’article How to Fix the etcd Error: “etcdserver: mvcc: database space exceeded” in a Patroni cluster est apparu en premier sur dbi Blog.
Upgrade etcd in a patroni cluster
In a distributed database system like PostgreSQL managed by Patroni, etcd plays a critical role as the distributed key-value store for cluster coordination and configuration. As your system evolves, upgrading etcd becomes necessary to leverage new features, bug fixes, and security enhancements. However, upgrading etcd in a live cluster requires careful planning and execution to ensure data integrity. In this guide, we’ll walk through the process of upgrading etcd from version 3.4.25 to 3.5.12 in a Patroni cluster, based on the detailed notes I took during the upgrade process.
Check the upgrade checklistBefore trying to upgrade, it is important to have a look at all the deprecated features and at the upgrade requirements. In our case, to upgrade to version 3.5.x, it is mandatory that the running cluster is healthy and at least in version 3.4 already.
You can find all this information on the official etcd documentation:
https://etcd.io/docs/v3.3/upgrades/upgrade_3_5/
During the upgrade process, an etcd cluster can accommodate a mix of etcd member versions, functioning based on the protocol of the lowest common version present. The cluster achieves the upgraded status only when all its members are updated to version 3.5. Internally, etcd members negotiate among themselves to establish the overall cluster version, influencing the reported version and the features supported by the cluster.
In most scenarios, transitioning from etcd 3.4 to 3.5 can be accomplished seamlessly through a rolling upgrade process, ensuring zero downtime. Sequentially halt the etcd v3.4 processes, substituting them with etcd v3.5 processes. Upon completion of the migration to v3.5 across all nodes, the enhanced functionalities introduced in v3.5 become accessible to the cluster.
Preparing for the UpgradeBefore starting the upgrade process, it’s essential to make adequate preparations to minimize any potential risks or disruptions. Here are some preliminary steps:
- Check current etcd version
[pgt001] postgres@patroni-1:/postgres/app/postgres> etcdctl version
etcdctl version: 3.4.25
API version: 3.4- Backup etcd data
Use etcdctl to create a snapshot of the etcd data. This ensures that you have a fallback option in case something goes wrong during the upgrade process.
[pgt001] postgres@patroni-1:~> etcdctl snapshot save backup.db
{"level":"info","ts":1710507460.523724,"caller":"snapshot/v3_snapshot.go:119","msg":"created temporary db file","path":"backup.db.part"}
{"level":"info","ts":"2024-03-15T13:57:40.538461+0100","caller":"clientv3/maintenance.go:200","msg":"opened snapshot stream; downloading"}
{"level":"info","ts":1710507460.539052,"caller":"snapshot/v3_snapshot.go:127","msg":"fetching snapshot","endpoint":"127.0.0.1:2379"}
{"level":"info","ts":"2024-03-15T13:57:40.548342+0100","caller":"clientv3/maintenance.go:208","msg":"completed snapshot read; closing"}
{"level":"info","ts":1710507460.5576544,"caller":"snapshot/v3_snapshot.go:142","msg":"fetched snapshot","endpoint":"127.0.0.1:2379","size":"57 kB","took":0.030259485}
{"level":"info","ts":1710507460.5580025,"caller":"snapshot/v3_snapshot.go:152","msg":"saved","path":"backup.db"}
Snapshot saved at backup.db
[pgt001] postgres@patroni-1:~> ll
total 60
-rw------- 1 postgres postgres 57376 Mar 15 13:57 backup.db

[pgt001] postgres@patroni-1:~> etcdctl --write-out=table snapshot status backup.db
+----------+----------+------------+------------+
|   HASH   | REVISION | TOTAL KEYS | TOTAL SIZE |
+----------+----------+------------+------------+
| 29c96081 |      107 |        117 |      57 kB |
+----------+----------+------------+------------+- Pause Cluster Management
Use Patroni’s patronictl to pause cluster management. This prevents any automated failover or configuration changes during the upgrade process. (https://patroni.readthedocs.io/en/latest/pause.html)
[pgt001] postgres@patroni-1:/postgres/app/postgres/local/dmk/bin> patronictl pause --wait
'pause' request sent, waiting until it is recognized by all nodes
Success: cluster management is pausedNow that you’ve prepared your cluster for the upgrade, you can proceed with the actual upgrade steps. All the steps are performed node by node, as mentioned earlier. I will start the upgrade on the third node of my cluster, patroni-3.
- Stop etcd
Stop the etcd service. This ensures that no changes are made to the cluster while the upgrade is in progress.
[pg133] postgres@patroni-3:/postgres/app/postgres/local/dmk/bin> sudo systemctl stop etcd- Extract and Install New etcd Version
Download the new etcd binary and extract it. Then, replace the existing etcd binaries with the new ones.
[pg133] postgres@patroni-3:/postgres/app/postgres/local/dmk/bin> tar axf etcd-v3.5.12-linux-amd64.tar.gz
[pg133] postgres@patroni-3:/postgres/app/postgres/local/dmk/bin> mv etcd-v3.5.12-linux-amd64/etcd* /postgres/app/postgres/local/dmk/bin/
[pg133] postgres@patroni-3:/postgres/app/postgres/local/dmk/bin> etcdctl version
etcdctl version: 3.5.12
API version: 3.5- Start etcd
Start the upgraded etcd service
[pg133] postgres@patroni-3:/postgres/app/postgres/local/dmk/bin> sudo systemctl start etcd
[pg133] postgres@patroni-3:/postgres/app/postgres/local/dmk/bin> sudo systemctl status etcd
● etcd.service - dbi services etcd service
     Loaded: loaded (/etc/systemd/system/etcd.service; enabled; preset: enabled)
     Active: active (running) since Fri 2024-03-15 14:02:39 CET; 10s ago
   Main PID: 1561 (etcd)
      Tasks: 9 (limit: 9454)
     Memory: 13.1M
        CPU: 369ms
     CGroup: /system.slice/etcd.service
             └─1561 /postgres/app/postgres/local/dmk/bin/etcd --config-file /postgres/app/postgres/local/dmk/etc/etcd.conf

Mar 15 14:02:38 patroni-3 etcd[1561]: {"level":"info","ts":"2024-03-15T14:02:38.292751+0100","caller":"etcdserver/server.go:783","msg":"initialized peer connections; fast-forwarding electi>
Mar 15 14:02:39 patroni-3 etcd[1561]: {"level":"info","ts":"2024-03-15T14:02:39.282054+0100","logger":"raft","caller":"etcdserver/zap_raft.go:77","msg":"raft.node: f1457fc5460d0329 elected>
Mar 15 14:02:39 patroni-3 etcd[1561]: {"level":"info","ts":"2024-03-15T14:02:39.302529+0100","caller":"etcdserver/server.go:2068","msg":"published local member to cluster through raft","lo>
Mar 15 14:02:39 patroni-3 etcd[1561]: {"level":"info","ts":"2024-03-15T14:02:39.302985+0100","caller":"embed/serve.go:103","msg":"ready to serve client requests"}
Mar 15 14:02:39 patroni-3 etcd[1561]: {"level":"info","ts":"2024-03-15T14:02:39.30307+0100","caller":"embed/serve.go:103","msg":"ready to serve client requests"}
Mar 15 14:02:39 patroni-3 etcd[1561]: {"level":"info","ts":"2024-03-15T14:02:39.302942+0100","caller":"etcdmain/main.go:44","msg":"notifying init daemon"}
Mar 15 14:02:39 patroni-3 etcd[1561]: {"level":"info","ts":"2024-03-15T14:02:39.303671+0100","caller":"etcdmain/main.go:50","msg":"successfully notified init daemon"}
Mar 15 14:02:39 patroni-3 systemd[1]: Started etcd.service - dbi services etcd service.
Mar 15 14:02:39 patroni-3 etcd[1561]: {"level":"info","ts":"2024-03-15T14:02:39.304964+0100","caller":"embed/serve.go:187","msg":"serving client traffic insecurely; this is strongly discou>
Mar 15 14:02:39 patroni-3 etcd[1561]: {"level":"info","ts":"2024-03-15T14:02:39.305719+0100","caller":"embed/serve.go:187","msg":"serving client traffic insecurely; this is strongly discou>
After each etcd upgrade, it’s always nice to verify the health and functionality of the etcd and Patroni cluster. You can notice from the etcdtcl command that the version was upgraded on the third node.
[pgt001] postgres@patroni-1:/postgres/app/postgres/local/dmk/bin> etcdctl endpoint status --cluster -w table
+----------------------------+------------------+---------+---------+-----------+------------+-----------+------------+--------------------+--------+
|          ENDPOINT          |        ID        | VERSION | DB SIZE | IS LEADER | IS LEARNER | RAFT TERM | RAFT INDEX | RAFT APPLIED INDEX | ERRORS |
+----------------------------+------------------+---------+---------+-----------+------------+-----------+------------+--------------------+--------+
| http://192.168.56.123:2379 | 90015c533cbf2e84 |  3.4.25 |   61 kB |     false |      false |        15 |        150 |                150 |        |
| http://192.168.56.124:2379 | 9fe85e3cebf257e3 |  3.4.25 |   61 kB |     false |      false |        15 |        150 |                150 |        |
| http://192.168.56.125:2379 | f1457fc5460d0329 |  3.5.12 |   61 kB |      true |      false |        15 |        150 |                150 |        |
+----------------------------+------------------+---------+---------+-----------+------------+-----------+------------+--------------------+--------+
[pgt001] postgres@patroni-1:/postgres/app/postgres/local/dmk/bin> patronictl list
+ Cluster: pgt001 (7346518467491201916) ----------+----+-----------+
| Member | Host | Role | State | TL | Lag in MB |
+----------+----------------+---------+-----------+----+-----------+
| pgt001_1 | 192.168.56.123 | Leader | running | 5 | |
| pgt001_2 | 192.168.56.124 | Replica | streaming | 5 | 0 |
+----------+----------------+---------+-----------+----+-----------+
Maintenance mode: on- Upgrading etcd on the second node of the cluster
[pgt001] postgres@patroni-2:/postgres/app/postgres/local/dmk/bin> sudo systemctl stop etcd
[pgt001] postgres@patroni-2:/postgres/app/postgres/local/dmk/bin> tar axf etcd-v3.5.12-linux-amd64.tar.gz
[pgt001] postgres@patroni-2:/postgres/app/postgres/local/dmk/bin> mv etcd-v3.5.12-linux-amd64/etcd* /postgres/app/postgres/local/dmk/bin/
[pgt001] postgres@patroni-2:/postgres/app/postgres/local/dmk/bin> etcdctl version
etcdctl version: 3.5.12
API version: 3.5
[pgt001] postgres@patroni-2:/postgres/app/postgres/local/dmk/bin> sudo systemctl start etcd
[pgt001] postgres@patroni-2:/postgres/app/postgres/local/dmk/bin> sudo systemctl status etcd
● etcd.service - dbi services etcd service
     Loaded: loaded (/etc/systemd/system/etcd.service; enabled; preset: enabled)
     Active: active (running) since Fri 2024-03-15 14:04:46 CET; 4s ago
   Main PID: 1791 (etcd)
      Tasks: 7 (limit: 9454)
     Memory: 9.7M
        CPU: 295ms
     CGroup: /system.slice/etcd.service
             └─1791 /postgres/app/postgres/local/dmk/bin/etcd --config-file /postgres/app/postgres/local/dmk/etc/etcd.conf

Mar 15 14:04:45 patroni-2 etcd[1791]: {"level":"info","ts":"2024-03-15T14:04:45.690431+0100","caller":"rafthttp/stream.go:274","msg":"established TCP streaming connection with remote peer">
Mar 15 14:04:46 patroni-2 etcd[1791]: {"level":"info","ts":"2024-03-15T14:04:46.739502+0100","logger":"raft","caller":"etcdserver/zap_raft.go:77","msg":"raft.node: 9fe85e3cebf257e3 elected>
Mar 15 14:04:46 patroni-2 etcd[1791]: {"level":"info","ts":"2024-03-15T14:04:46.75204+0100","caller":"etcdserver/server.go:2068","msg":"published local member to cluster through raft","loc>
Mar 15 14:04:46 patroni-2 etcd[1791]: {"level":"info","ts":"2024-03-15T14:04:46.752889+0100","caller":"embed/serve.go:103","msg":"ready to serve client requests"}
Mar 15 14:04:46 patroni-2 etcd[1791]: {"level":"info","ts":"2024-03-15T14:04:46.753543+0100","caller":"etcdmain/main.go:44","msg":"notifying init daemon"}
Mar 15 14:04:46 patroni-2 systemd[1]: Started etcd.service - dbi services etcd service.
Mar 15 14:04:46 patroni-2 etcd[1791]: {"level":"info","ts":"2024-03-15T14:04:46.754213+0100","caller":"embed/serve.go:187","msg":"serving client traffic insecurely; this is strongly discou>
Mar 15 14:04:46 patroni-2 etcd[1791]: {"level":"info","ts":"2024-03-15T14:04:46.757187+0100","caller":"embed/serve.go:103","msg":"ready to serve client requests"}
Mar 15 14:04:46 patroni-2 etcd[1791]: {"level":"info","ts":"2024-03-15T14:04:46.757933+0100","caller":"embed/serve.go:187","msg":"serving client traffic insecurely; this is strongly discou>
Mar 15 14:04:46 patroni-2 etcd[1791]: {"level":"info","ts":"2024-03-15T14:04:46.75994+0100","caller":"etcdmain/main.go:50","msg":"successfully notified init daemon"}


[pgt001] postgres@patroni-2:/postgres/app/postgres/local/dmk/bin> patronictl list
+ Cluster: pgt001 (7346518467491201916) ----------+----+-----------+
| Member   | Host           | Role    | State     | TL | Lag in MB |
+----------+----------------+---------+-----------+----+-----------+
| pgt001_1 | 192.168.56.123 | Leader  | running   |  5 |           |
| pgt001_2 | 192.168.56.124 | Replica | streaming |  5 |         0 |
+----------+----------------+---------+-----------+----+-----------+
 Maintenance mode: on
- Upgrading etcd on the third node of the cluster
[pgt001] postgres@patroni-1:/postgres/app/postgres/local/dmk/bin> sudo systemctl stop etcdNow that we stopped etcd on the server where is our Patroni leader node, let’s take a look at our patroni cluster status.
[pgt001] postgres@patroni-2:/postgres/app/postgres/local/dmk/bin> patronictl list
2024-03-15 14:05:52,778 - ERROR - Failed to get list of machines from http://192.168.56.123:2379/v3beta: MaxRetryError("HTTPConnectionPool(host='192.168.56.123', port=2379): Max retries exceeded with url: /version (Caused by NewConnectionError('<urllib3.connection.HTTPConnection object at 0x7f3584365590>: Failed to establish a new connection: [Errno 111] Connection refused'))")
+ Cluster: pgt001 (7346518467491201916) ----------+----+-----------+
| Member   | Host           | Role    | State     | TL | Lag in MB |
+----------+----------------+---------+-----------+----+-----------+
| pgt001_1 | 192.168.56.123 | Leader  | running   |  5 |           |
| pgt001_2 | 192.168.56.124 | Replica | streaming |  5 |         0 |
+----------+----------------+---------+-----------+----+-----------+
 Maintenance mode: on
[pgt001] postgres@patroni-2:/postgres/app/postgres/local/dmk/bin> sq
psql (14.7 dbi services build)
Type "help" for help.

postgres=# exit
We can notice that our Patroni cluster is still up and running and that PostgreSQL cluster is still reachable. Also, thanks to patroni maintenance mode, no failover or configuration changes are happening.
Let’s continue with the installation
[pgt001] postgres@patroni-1:/postgres/app/postgres/local/dmk/bin> tar axf etcd-v3.5.12-linux- amd64.tar.gz
[pgt001] postgres@patroni-1:/postgres/app/postgres/local/dmk/bin> mv etcd-v3.5.12-linux-amd64 /etcd* /postgres/app/postgres/local/dmk/bin/
[pgt001] postgres@patroni-1:/postgres/app/postgres/local/dmk/bin> etcdctl version
etcdctl version: 3.5.12
API version: 3.5
[pgt001] postgres@patroni-1:/postgres/app/postgres/local/dmk/bin> sudo systemctl start etcd
[pgt001] postgres@patroni-1:/postgres/app/postgres/local/dmk/bin> sudo systemctl status etcd
● etcd.service - dbi services etcd service
Loaded: loaded (/etc/systemd/system/etcd.service; enabled; preset: enabled)
Active: active (running) since Fri 2024-03-15 14:07:12 CET; 3s ago
Main PID: 1914 (etcd)
Tasks: 7 (limit: 9454)
Memory: 15.9M
CPU: 160ms
CGroup: /system.slice/etcd.service
└─1914 /postgres/app/postgres/local/dmk/bin/etcd --config-file /postgres/app/postgres/local/dmk/etc/etcd.conf

Mar 15 14:07:12 patroni-1 etcd[1914]: {"level":"info","ts":"2024-03-15T14:07:12.180191+0100","caller":"etcdserver/server.go:2068","msg":"published local member to cluster through raft","lo>
Mar 15 14:07:12 patroni-1 etcd[1914]: {"level":"info","ts":"2024-03-15T14:07:12.180266+0100","caller":"embed/serve.go:103","msg":"ready to serve client requests"}
Mar 15 14:07:12 patroni-1 etcd[1914]: {"level":"info","ts":"2024-03-15T14:07:12.181162+0100","caller":"embed/serve.go:103","msg":"ready to serve client requests"}
Mar 15 14:07:12 patroni-1 etcd[1914]: {"level":"info","ts":"2024-03-15T14:07:12.182377+0100","caller":"embed/serve.go:187","msg":"serving client traffic insecurely; this is strongly discou>
Mar 15 14:07:12 patroni-1 etcd[1914]: {"level":"info","ts":"2024-03-15T14:07:12.182625+0100","caller":"embed/serve.go:187","msg":"serving client traffic insecurely; this is strongly discou>
Mar 15 14:07:12 patroni-1 etcd[1914]: {"level":"info","ts":"2024-03-15T14:07:12.183861+0100","caller":"etcdmain/main.go:44","msg":"notifying init daemon"}
Mar 15 14:07:12 patroni-1 systemd[1]: Started etcd.service - dbi services etcd service.
Mar 15 14:07:12 patroni-1 etcd[1914]: {"level":"info","ts":"2024-03-15T14:07:12.187771+0100","caller":"etcdmain/main.go:50","msg":"successfully notified init daemon"}
Mar 15 14:07:12 patroni-1 etcd[1914]: {"level":"info","ts":"2024-03-15T14:07:12.195369+0100","caller":"membership/cluster.go:576","msg":"updated cluster version","cluster-id":"571a53e78674>
Mar 15 14:07:12 patroni-1 etcd[1914]: {"level":"info","ts":"2024-03-15T14:07:12.195541+0100","caller":"api/capability.go:75","msg":"enabled capabilities for version","cluster-version":"3.5>
We now have upgraded etcd on all our nodes and we need to control the status of our clusters.
[pgt001] postgres@patroni-1:/postgres/app/postgres/local/dmk/bin> patronictl list
+ Cluster: pgt001 (7346518467491201916) ----------+----+-----------+
| Member   | Host           | Role    | State     | TL | Lag in MB |
+----------+----------------+---------+-----------+----+-----------+
| pgt001_1 | 192.168.56.123 | Leader  | running   |  5 |           |
| pgt001_2 | 192.168.56.124 | Replica | streaming |  5 |         0 |
+----------+----------------+---------+-----------+----+-----------+

[pgt001] postgres@patroni-1:/postgres/app/postgres/local/dmk/bin> etcdctl endpoint status --cluster -w table
+----------------------------+------------------+---------+---------+-----------+------------+-----------+------------+--------------------+--------+
|          ENDPOINT          |        ID        | VERSION | DB SIZE | IS LEADER | IS LEARNER | RAFT TERM | RAFT INDEX | RAFT APPLIED INDEX | ERRORS |
+----------------------------+------------------+---------+---------+-----------+------------+-----------+------------+--------------------+--------+
| http://192.168.56.123:2379 | 90015c533cbf2e84 |  3.5.12 |   61 kB |     false |      false |        15 |        150 |                150 |        |
| http://192.168.56.124:2379 | 9fe85e3cebf257e3 |  3.5.12 |   61 kB |     false |      false |        15 |        150 |                150 |        |
| http://192.168.56.125:2379 | f1457fc5460d0329 |  3.5.12 |   61 kB |      true |      false |        15 |        150 |                150 |        |
+----------------------------+------------------+---------+---------+-----------+------------+-----------+------------+--------------------+--------+

[pgt001] postgres@patroni-1:/postgres/app/postgres/local/dmk/bin> etcdctl version
etcdctl version: 3.5.12
API version: 3.5Once you’ve confirmed that the upgrade was successful, resume cluster management to allow Patroni to resume its normal operations and quit maintenance mode.
[pgt001] postgres@patroni-1:/postgres/app/postgres/local/dmk/bin> patronictl resume --wait
'resume' request sent, waiting until it is recognized by all nodes
Success: cluster management is resumed
[pgt001] postgres@patroni-1:/postgres/app/postgres/local/dmk/bin> patronictl list
+ Cluster: pgt001 (7346518467491201916) ----------+----+-----------+
| Member   | Host           | Role    | State     | TL | Lag in MB |
+----------+----------------+---------+-----------+----+-----------+
| pgt001_1 | 192.168.56.123 | Leader  | running   |  5 |           |
| pgt001_2 | 192.168.56.124 | Replica | streaming |  5 |         0 |
+----------+----------------+---------+-----------+----+-----------+Upgrading etcd in a Patroni cluster is a critical maintenance task that requires careful planning and execution. By following the steps outlined in this guide and leveraging the detailed notes taken during the upgrade process, you can ensure a smooth and successful upgrade while ensuring data integrity. Remember to always test the upgrade process in a staging environment before performing it in production to mitigate any potential risks.
L’article Upgrade etcd in a patroni cluster est apparu en premier sur dbi Blog.
What DEVs need to hear from a DBA and why SQL and RDBMS still matters…
 The Average case
As a skilled developer, you are well-versed in the latest trends and fully capable of building an application from scratch. From the frontend to the RESTful API backend, through to the ORM and the database, you have experienced it all.
Having participated in numerous projects and developed substantial code, you have begun to receive feedback from your Sysadmins and users of applications you programmed a few years ago. The application is starting to have performance issues…
-“Simple ! The number of users increased ! The database is now 600GB ! We should provide more resources to the PODs and VMs (my code is good and don’t need rewriting; refactoring was done properly…).”
Makes sense, but the sysadmins tripled the number of CPU and Memory without any benefits whatsoever.
-“Look the database server is too slow the queries are not fast enough !
A DBA should be able to fix that !”
-“We don’t have any, we should call a consultant to make a performance review and help us out of this mess. Customers are still complaining, it is time to invest…”
That’s where a DBA consultant (me) comes along and performs required maintenance and tries to apply standard best practices, tune some parameters here or there and exposes the most intensive queries that need tuning….
Then the DEV Team explains they are using an ORM and can’t “tune Queries” or touch the SQL code because they don’t want to, it would have too many implications on business logic and architecture, and also, they don’t know SQL all that much; it is an old language they used back in their early days as developer.
 1. Why SQL and RDBMS (still)?
As a developer don’t overlook SQL and RDBMS like PostgreSQL. It is still the best way to store and access data when relation between data is important and when that relation can be defined beforehand and is stable (which is usually the case in businesses).
In the following example there are several benefits/reasons for using a RDBMS :
- Data integrity: Enforced by foreign keys and other constraints the table design ensures that the data remains accurate, and consistent, preventing issues like orphaned records.
In this case, an order cannot exist without a customer, and a line item cannot exist without an associated product and order. - Complex Queries: RDBMS are made for JOINs between tables. All the architecture of an RDBMS is helping providing facilities to retrieve and store data efficiently.
- Transaction support: If your requirements are like in this example, an order with multiple steps in it (updating inventory, creating an order record…) must complete successfully together or not at all.
   SELECT o.order_id, c.name, p.name, od.quantity, p.price, (od.quantity * p.price) AS total_cost
   FROM Orders o
   JOIN Customers c ON o.customer_id = c.customer_id
   JOIN Order_Details od ON o.order_id = od.order_id
   JOIN Products p ON od.product_id = p.product_id
   WHERE c.name = 'Bob Kowalski'
   ORDER BY o.order_date DESC
   LIMIT 100;
NoSQL DB like MongoDB or Cassandra are designed for scalability and flexibility in storing unstructured data, complex joins and transactions are not supported in the same way. They are more suitable if your data structure changes frequently and the application demands high write throughput and horizontal scalability.
In our example an RDBMS like MySQL, MariaDB or PostgreSQL is the best choice to store the “statefullness” of your application but you could use NoSQL DBMS like Redis to cache some data and help not putting too much pressure on the RDBMS by making less calls to it. No one needs to retrieve the same data 50000 times per minute… Use the cache Luke… use the cache…

It would be silly to tell you “Don’t use NoSQL, RDBMS is king !”.
Use them both and understand their limitations.
DEVs love their NoSQL because having a schema-less architecture helps them scale easily and achieve better integration with CI/CD processes, which is traditionally difficult with RDBMS, bonus point for not having to talk to a DBA (which I understand, I talk to myself already enough:)…
In this instance, and perhaps in life overall, one should consider bypassing standardized models and rules established by predecessors only if you comprehend the implications and the original reasons for their existence.
Yes and no. ORMs are one of the good things that happened to Developers and DBAs. It helps creating better code in most of the case and they become quite tunable nowadays.
So please keep your ORM, you need it today since it creates a level of abstraction that is helpful for simple queries and scalable logic and gets you faster and closer to delivery.
The thing is that you have to understand their limitations. And as DBA I am fine with using 100% of ORMs SQL, up until you have a performance issue.
If for some reason your application gets some success and is used enough so that you are being pushed by the business to do better, ask the DBA to provide you the top 10 queries of the last weeks and understand how you can tune those and maybe not use the ORM in some cases.
When the ORM is producing suboptimal queries (queries not performing well enough for business), it might be for several reasons :
- Abstraction: To produce queries, an ORM has to generalize them is such a way that it can cause performance issues. Because the ORM can’t think of all the cases and doesn’t know your data.
- N+1 Problem: Commonly known, this issue is generating more roundtrip calls than it’s advisable to the RDBMS and has been well documented in most documentation since the early 2000s. In general, just think about the data you need and try to understand if you can solve it by creating a query with appropriate JOINs and fetch the required data in one go.
ORMs (Hibernate or Entity for example) allow specifying a batch size for fetching related entities. This means instead of one query per related entity, the ORM will group several entities into fewer queries. Some other ways on the RDBMS side can mitigate those aspects as well like proper indexing, views, materialized views,… - Complex joins: What? an RDBMS can’t handle a lot of JOINs ?! It depends on what you mean by a lot, but generally, RDBMS like SQL Server are having a hard time with more than 6 or 7 JOINs, PostgreSQL you could go a bit further and use GEQO algorithm at the cost of planning time of your execution plan, but overall, an optimizer can’t produce a proper query plan when the cardinality tends towards infinity… which is the case when your ORM queries are generating queries with 86 JOINs !
Note: Understand that it is not just about the number of JOINs. Schema Design indexes and the optimizer capabilities are critical aspects of performance levels, most of the time people are hitting limitations in a RDBMS because they don’t recognize their existence.
If you want to get more info and best practices about ORM I suggest reading this : Hibernate Best Practices (thorben-janssen.com)
4. Performance optimization paths for RDBMS:In addition to what has been said already, you can also optimize your instance to work better.
Earlier, I discussed the limitations on the number of JOINs an optimizer can handle. It’s crucial to recognize that an optimizer’s capabilities are affected by schema design, indexes, and the queries themselves! Like said often by Brent Ozar, you have 3 buttons that you can play with to get better performance : TABLE design, QUERY design and Resources.
People often play with the third one because it is easy to request for more CPU and Memory… cloud providers make you pay for that, it is less the case nowadays though.
So for me you can request additional training for your team, numerous companies offer performance training dedicated for Oracle, SQL Server, PostgreSQL, MariaDB, MySQL,…. and DBI services is one of them.
But you could also first, take leverage of modern monitoring and tools like Query Store on SQL Server or PGANALYZE on PostgreSQL to understand better where your performance bottleneck is.
In most cases, it is easy to query for the top 20 resource-intensive queries, usually in those you will have 3 or 4 that are consuming more resources by 10x. Try to understand why that is and get specialized help if you can’t.
- It is still a matter of using the proper tool for the proper job. Building an architecture based on ORM is a good practice and even if you need to store JSON in the database, I am still up for that ( PostgreSQL supports it in the best way possible ).
- Be prepared that if along the way you need to get more performance at scale, you’ll need to be prepared for a hybrid approach. Using ORM for simple CRUD and raw SQL for the relevant queries. ORM do support writing Native SQL Queries, don’t be afraid to use it.
- In addition use cache capabilities when you can.
- Consult with your Sysadmins and DBAs, they know stuff on your app you want to hear. Trust me on that, they want to help (most of the time:).
Often different teams don’t have the same monitoring tools and don’t look at the same metrics. It is important to understand why. - Be sure to update your knowledge. Often enough I still see DEVs that still are having hard time understanding key concepts or evolution of the best practices… (stored procedures, anti or semi-joins, ….etc).
I do understand that most DEVs are not building a new app every morning from scratch most of them inherit code and logic from old applications build some time ago, architectural decisions are not so often in their hands. Even then, I think we are at a cornerstone of IT evolution, and the next years will be filled with opportunities and new tech, but for the past years most of the projects I have seen failed performance wise, were due to miss communication and over simplifications of complex systems. Platform engineering should solve that and put away the overhead of managing all systems without knowing them all…
L’article What DEVs need to hear from a DBA and why SQL and RDBMS still matters… est apparu en premier sur dbi Blog.
Alfresco – Mass removal/cleanup of documents
At a customer, I recently had a case where a mass-import job was executed on an interface that, in the background, uses Alfresco for document and metadata storage. From the point of view of the interface team, there was no problem as documents were properly being created in Alfresco (although performance wasn’t exceptional). However, after some time, our monitoring started sending us alerts that Solr indexing nearly stopped / was very slow. I might talk about the Solr part in a future blog but what happened is that the interface was configured to import documents into Alfresco in a way that caused too many documents in a single folder.
Too many documents in the same folder of AlfrescoThe interface was trying to import documents in the folder “YYYY/MM/DD/HH” (YYYY being the year, MM the month, DD the day and HH the hour). This might be fine for Business-As-Usual (BAU), when the load isn’t too high, but when mass-importing documents, that meant several thousand documents per folder (5’000, 10’000, 20’000, …), the limit being what Alfresco can ingest in an hour or what the interface manages to send. As you probably know, Alfresco definitively doesn’t like folders with much more than a thousand nodes inside (in particular because of associations and indexing design)… When I saw that, I asked the interface team to stop the import job, but unfortunately, it wasn’t stopped right away and almost 190 000 documents were already imported into Alfresco.
Alfresco APIs for the win?You cannot really let Alfresco in this state since Solr would heavily be impacted by this kind of situation and any change to a document in such folder could result in heavy load. Therefore, from my point of view, the best is to remove the documents and execute a new/correct import with a better distribution of documents per folder.
A first solution could be to restore the DB to a point in time before the activity started, but that means a downtime and anything else that happened in the meantime would be lost. A second option would be to find all the documents imported and remove them through API. As you might know, Share UI will not really be useful in this case since Share will either crash or just take way too long to open the folder, so don’t even try… And even if it is able to somehow open the folder containing XX’XXX nodes, you probably shouldn’t try to delete it because it will take forever, and you will not be able to know what’s the status of this process that runs in the background. Therefore, from my point of view, the only reasonable solution is through API.
Finding documents to deleteAs mentioned, Solr indexing was nearly dead, so I couldn’t rely on it to find what was imported recently. Using REST-API could be possible but there are some limitations when working with huge set of results. In this case, I decided to go with a simple DB query (if you are interested in useful Alfresco DB queries), listing all documents created since the start of the mass-import by the interface user:
SQL> SELECT n.id AS "Node ID",
  n.store_id AS "Store ID",
  n.uuid AS "Document ID (UUID)",
  n.audit_creator AS "Creator",
  n.audit_created AS "Creation Date",
  n.audit_modifier AS "Modifier",
  n.audit_modified AS "Modification Date",
  n.type_qname_id
FROM alfresco.alf_node n,
  alfresco.alf_node_properties p
WHERE n.id=p.node_id
  AND p.qname_id=(SELECT id FROM alf_qname WHERE local_name='content')
  AND n.audit_created>='2023-11-23T19:00:00Z'
  AND n.audit_creator='itf_user'
  AND n.audit_created is not null;
In case the interface isn’t using a dedicated user for the mass-import process, it might be a bit more difficult to find the correct list of documents to be removed, as you would need to take care not to remove the BAU documents… Maybe using a recursive query based on the folder on which the documents were imported or some custom type/metadata or similar. The result of the above query was put in a text file for the processing:
alfresco@acs01:~$ cat alfresco_documents.txt
  Node ID Store ID Document ID (UUID)                   Creator   Creation Date             Modifier  Modification Date         TYPE_QNAME_ID
--------- -------- ------------------------------------ --------- ------------------------- --------- ------------------------- -------------
156491155        6 0f16ef7a-4cf1-4304-b578-71480570c070 itf_user  2023-11-23T19:01:02.511Z  itf_user  2023-11-23T19:01:03.128Z            265
156491158        4 2f65420a-1105-4306-9733-210501ae7efb itf_user  2023-11-23T19:01:03.198Z  itf_user  2023-11-23T19:01:03.198Z            265
156491164        6 a208d56f-df1a-4f2f-bc73-6ab39214b824 itf_user  2023-11-23T19:01:03.795Z  itf_user  2023-11-23T19:01:03.795Z            265
156491166        4 908d385f-d6bb-4b94-ba5c-6d6942bb75c3 itf_user  2023-11-23T19:01:03.918Z  itf_user  2023-11-23T19:01:03.918Z            265
...
159472069        6 cabf7343-35c4-4e8b-8a36-0fa0805b367f itf_user  2023-11-24T07:50:20.355Z  itf_user  2023-11-24T07:50:20.355Z            265
159472079        4 1bcc7301-97ab-4ddd-9561-0ecab8d09efb itf_user  2023-11-24T07:50:20.522Z  itf_user  2023-11-24T07:50:20.522Z            265
159472098        6 19d1869c-83d9-449a-8417-b460ccec1d60 itf_user  2023-11-24T07:50:20.929Z  itf_user  2023-11-24T07:50:20.929Z            265
159472107        4 bcd0f8a2-68b3-4cc9-b0bd-2af24dc4ff43 itf_user  2023-11-24T07:50:21.074Z  itf_user  2023-11-24T07:50:21.074Z            265
159472121        6 74bbe0c3-2437-4d16-bfbc-97bfa5a8d4e0 itf_user  2023-11-24T07:50:21.365Z  itf_user  2023-11-24T07:50:21.365Z            265
159472130        4 f984679f-378b-4540-853c-c36f13472fac itf_user  2023-11-24T07:50:21.511Z  itf_user  2023-11-24T07:50:21.511Z            265
159472144        6 579a2609-f5be-47e4-89c8-daaa983a314e itf_user  2023-11-24T07:50:21.788Z  itf_user  2023-11-24T07:50:21.788Z            265
159472153        4 7f408815-79e1-462a-aa07-182ee38340a3 itf_user  2023-11-24T07:50:21.941Z  itf_user  2023-11-24T07:50:21.941Z            265

379100 rows selected.
alfresco@acs01:~$
The above Store ID of ‘6’ is for the ‘workspace://SpacesStore‘ (live document store) and ‘4’ is for the ‘workspace://version2Store‘ (version store):
SQL> SELECT id, protocol, identifier FROM alf_store;
 ID PROTOCOL   IDENTIFIER
--- ---------- ----------
  1 user       alfrescoUserStore
  2 system     system
  3 workspace  lightWeightVersionStore
  4 workspace  version2Store
  5 archive    SpacesStore
  6 workspace  SpacesStore
Looking at the number of rows for each Store ID gives the exact same number and confirms there are no deleted documents yet:
alfresco@acs01:~$ grep "  4 " alfresco_documents.txt | wc -l
189550
alfresco@acs01:~$
alfresco@acs01:~$ grep "  5 " alfresco_documents.txt | wc -l
0
alfresco@acs01:~$
alfresco@acs01:~$ grep "  6 " alfresco_documents.txt | wc -l
189550
alfresco@acs01:~$
Therefore, there is around 190k docs to remove in total, which is roughly the same number seen in the filesystem. The Alfresco ContentStore has a little bit more obviously since it also contains the BAU documents.
REST-API environment preparationNow that the list is complete, the next step is to extract the IDs of the documents, so that we can use these in REST-API calls. The IDs are simply the third column from the file (Document ID (UUID)):
alfresco@acs01:~$ grep "  6 " alfresco_documents.txt | awk '{print $3}' > input_file_6_id.txt
alfresco@acs01:~$
alfresco@acs01:~$ wc -l alfresco_documents.txt input_file_6_id.txt
   379104 alfresco_documents.txt
   189550 input_file_6_id.txt
   568654 total
alfresco@acs01:~$
Now, to be able to execute REST-API calls, we will also need to define the username/password as well as the URL to be used. I executed the REST-API calls from the Alfresco server itself, so I didn’t really need to think too much about security, and I just used a BASIC authorization method using localhost and HTTPS. If you are executing that remotely, you might want to use tickets instead (and obviously keep the HTTPS protocol). To prepare for the removal, I defined the needed environment variables as follow:
alfresco@acs01:~$ alf_user=admin
alfresco@acs01:~$ read -s -p "Enter ${alf_user} password: " alf_passwd
Enter admin password:
alfresco@acs01:~$
alfresco@acs01:~$ auth=$(echo -n "${alf_user}:${alf_passwd}" | base64)
alfresco@acs01:~$
alfresco@acs01:~$ alf_base_url="https://localhost:8443/alfresco"
alfresco@acs01:~$ alf_node_url="${alf_base_url}/api/-default-/public/alfresco/versions/1/nodes"
alfresco@acs01:~$
alfresco@acs01:~$ input_file="$HOME/input_file_6_id.txt"
alfresco@acs01:~$ output_file="$HOME/output_file_6.txt"
alfresco@acs01:~$
With the above, we have our authorization string (base64 encoding of ‘username:password‘) as well as the Alfresco API URL. In case you wonder, you can find the definition of the REST-APIs in the Alfresco API Explorer. I also defined the input file, which contains all document IDs and an output file, which will contain the list of all documents processed, with the outcome of the command, to be able to check for any issues and follow the progress.
Deleting documents with REST-APIThe last step is now to create a small command/script that will execute the deletion of the documents in REST-API. Things to note here is that I’m using ‘permanent=true‘ so that the documents will not end-up in the trashcan but will be completely and permanently deleted. Therefore, you need to make sure the list of documents is correct! You can obviously set that parameter to false if you really want to, but please be aware that it will impact the performance quite a bit… Otherwise the command is fairly simple, it loops on the input file, execute the deletion query, get its output and log it:
alfresco@acs01:~$ while read -u 3 line; do
  out=$(curl -k -s -X DELETE "${alf_node_url}/${line}?permanent=true" -H "accept: application/json" -H "Authorization: Basic ${auth}" | sed 's/.*\(statusCode":[0-9]*\),.*/\1/')
  echo "${line} -- ${out}" >> "${output_file}"
done 3< "${input_file}"
The above is the simplest way/form of removal, with a single thread executed on a single server. You can obviously do multi-threaded deletions by splitting the input file into several and triggering commands in parallel, either on the same host or even on other hosts (if you have an Alfresco Cluster). In this example, I was able to get a consistent throughput of ~3130 documents deleted every 5 minutes, which means ~10.4 documents deleted per second. Again, that was on a single server with a single thread:
alfresco@acs01:~$ while true; do
  echo "$(date) -- $(wc -l output_file_6.txt)"
  sleep 300
done
Fri Nov 24 09:57:38 CET 2023 -- 810 output_file_6.txt
...
Fri Nov 24 10:26:55 CET 2023 -- 18920 output_file_6.txt
Fri Nov 24 10:31:55 CET 2023 -- 22042 output_file_6.txt
Fri Nov 24 10:36:55 CET 2023 -- 25180 output_file_6.txt
Fri Nov 24 10:41:55 CET 2023 -- 28290 output_file_6.txt
...
Since the cURL output (‘statusCode‘) is also recorded in the log file, I was able to confirm that 100% of the queries were successfully executed and all my documents were permanently deleted. With multi-threading and offloading to other members of the Cluster, it would have been possible to increase that by a lot (x5? x10? x20?) but that wasn’t needed in this case since the interface job needed to be updated before a new import could be triggered.
L’article Alfresco – Mass removal/cleanup of documents est apparu en premier sur dbi Blog.
Add authentication in a Feathers.js REST API
Following on from my previous articles: Create REST API from your database in minute with Feathers.js, and Add a UI to explore the Feathers.js API, today I want to add authentication in my Feathers.js REST API. Creation, update and delete operations will be authenticated, while read will remain public.
First step: add authentication to my applicationI’m using the code from my previous articles, and I add the authentication to my Feathers.js API. I use the CLI, it’s quick and easy:
npx feathers generate authenticationI want a simple user + password authentication. To achieve this, I’ve configured my authentication service as follows:
? Which authentication methods do you want to use? Email + Password
? What is your authentication service name? user
? What path should the service be registered on? users
? What database is the service using? SQL
? Which schema definition format do you want to use? TypeBox
Now I have an authentication method available in my application. If you look at the code, a new service users has been generated. It’s used to be retrieved users from the database. I won’t explain here how to create a user, but you can refer to the documentation.
Second step: authenticate the serviceAdditionally, I’m now going to define which method is authenticated in my service. To do this, I open the workshop.ts file. The important part of the code for this configuration is this:
  // Initialize hooks
  app.service(workshopPath).hooks({
    around: {
      all: [
        schemaHooks.resolveExternal(workshopExternalResolver),
        schemaHooks.resolveResult(workshopResolver)
      ]
    },
    before: {
      all: [
        schemaHooks.validateQuery(workshopQueryValidator),
        schemaHooks.resolveQuery(workshopQueryResolver)
      ],
      find: [],
      get: [],
      create: [
        schemaHooks.validateData(workshopDataValidator),
        schemaHooks.resolveData(workshopDataResolver)
      ],
      patch: [
        schemaHooks.validateData(workshopPatchValidator),
        schemaHooks.resolveData(workshopPatchResolver)
      ],
      remove: []
    },
    after: {
      all: []
    },
    error: {
      all: []
    }
  })
I add the “authenticate(‘jwt’)” function in create, patch and remove into the before block. This function check the credentials before the call of the main function.
  before: {
    ...
    create: [
      schemaHooks.validateData(workshopDataValidator),
      schemaHooks.resolveData(workshopDataResolver),
      authenticate('jwt')
    ],
    patch: [
      schemaHooks.validateData(workshopPatchValidator),
      schemaHooks.resolveData(workshopPatchResolver),
      authenticate('jwt')
    ],
    remove: [authenticate('jwt')]
  },
The basic authentication (user + password from the db) is managed by Feathers.js, which generates a JWT token on login.
Verify service authenticationFinally, I test the authentication of my service. To do this, I use the Swagger interface configured earlier. The POST method for creating a new record is now authenticated:
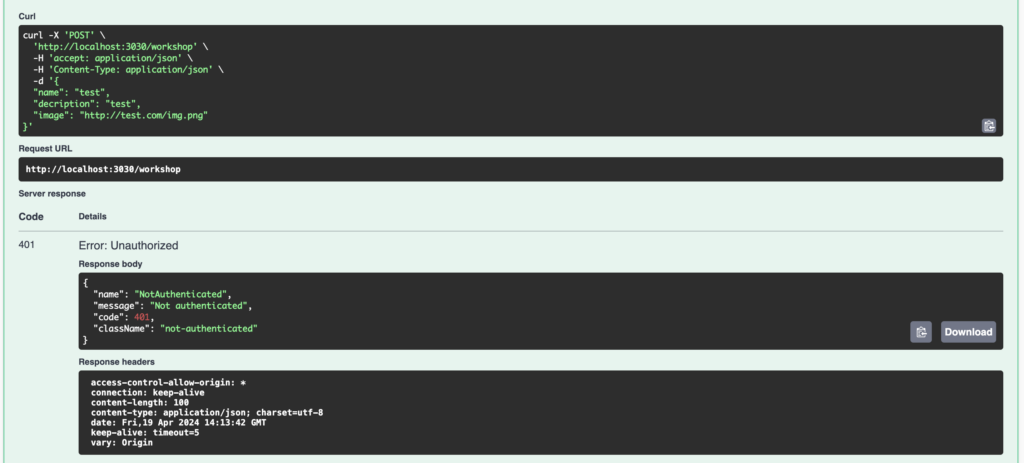
Authentication works correctly, but as I don’t pass a JWT token, I get the error 401 Unauthorized.
ConclusionAdding authentication to a Feathers.js REST API is as easy as generating the service itself.
Feathers.js offers different authentication strategies, such as Local (user + password), JWT or oAuth. But if that’s not enough, you can also create a custom strategy.
In a future article, I’ll explain how to adapt the Swagger interface to manage authentication.
L’article Add authentication in a Feathers.js REST API est apparu en premier sur dbi Blog.
Detect XZ Utils CVE 2024-3094 with Tetragon
The recent discovery of the XZ Utils backdoor, classified as CVE 2024-3094, has been now well documented. Detecting it with Tetragon from Isovalent (now part of Cisco) has been explained in this blog post. I also did some research and experimented with this vulnerability. I wondered how we could leverage Tetragon capabilities to detect it before it was known. There are other vulnerabilities out there, so we need to be prepared for the unknown. For this we have to apply a security strategy called Zero Trust. I wrote another blog post on this topic with another example and another tool if you want to have a look. Let’s build an environment on which we can experiment and learn more about it. Follow along!
 Setup an environment for CVE 2024-3094
We have learned that this vulnerability needs an x86 architecture to be exploited and that it targets several Linux distribution (source here). I’ve used an Ubuntu 22.04 virtual machine in Azure to setup the environment. To exploit this vulnerability, we’re going to use the GitHub resource here.
This vulnerability is related to the library liblzma.so used by the ssh daemon so let’s switch to the root user and install openssh-server along with other packages we will use later:
azureuser@Ubuntu22:~$ sudo -i

root@Ubuntu22:~# apt-get update && apt-get install -y golang-go curl openssh-server net-tools python3-pip wget vim git file bsdmainutils jq
Let’s use ssh key authentication (as this is how the vulnerable library can be exploited), start the ssh daemon and see which version of the library it uses:
root@Ubuntu22:~# which sshd
/usr/sbin/sshd
root@Ubuntu22:~# sed -E -i 's/^#?PasswordAuthentication .*/PasswordAuthentication no/' /etc/ssh/sshd_config

root@Ubuntu22:~# service ssh status
 * sshd is not running
root@Ubuntu22:~# service ssh start
 * Starting OpenBSD Secure Shell server sshd
root@Ubuntu22:~# service ssh status
 * sshd is running

root@Ubuntu22:~# ldd /usr/sbin/sshd|grep liblzma
	liblzma.so.5 => /lib/x86_64-linux-gnu/liblzma.so.5 (0x00007ae3aac37000)

root@Ubuntu22:~# file /lib/x86_64-linux-gnu/liblzma.so.5
/lib/x86_64-linux-gnu/liblzma.so.5: symbolic link to liblzma.so.5.2.5
Here it uses version 5.2.5, sometimes it uses version 5.4.5 from the tests I did on other distributions. The vulnerable versions are 5.6.0 and 5.6.1. So by default our machine is not vulnerable. To make it so, we need to upgrade this library to one of these vulnerable versions as shown below:
root@Ubuntu22:~# wget https://snapshot.debian.org/archive/debian/20240328T025657Z/pool/main/x/xz-utils/liblzma5_5.6.1-1_amd64.deb

root@Ubuntu22:~# apt-get install --allow-downgrades --yes ./liblzma5_5.6.1-1_amd64.deb

root@Ubuntu22:~# file /lib/x86_64-linux-gnu/liblzma.so.5
/lib/x86_64-linux-gnu/liblzma.so.5: symbolic link to liblzma.so.5.6.1
We are now using the vulnerable library in version 5.6.1. Next we can use the files and xzbot tool from the GitHub project as shown below:
root@Ubuntu22:~# git clone https://github.com/amlweems/xzbot.git
root@Ubuntu22:~# cd xzbot/
To be able to exploit this vulnerability we can’t just use the vulnerable library. In fact the backdoor uses a hardcoded ED448 public key for signature and we don’t have the associated private key. To be able to trigger that backdoor, the author of the tool xzbot replaced them with their own key pair they’ve generated. We then need to replace the vulnerable library with the patched one using these keys as follows:
root@Ubuntu22:~# cp ./assets/liblzma.so.5.6.1.patch /lib/x86_64-linux-gnu/liblzma.so.5.6.1
Now everything is ready to exploit this vulnerability with the xzbot tool. We just need to compile it with the go package we installed at the beginning:
root@Ubuntu22:~# go build

root@Ubuntu22:~# ./xzbot -h
Usage of ./xzbot:
  -addr string
    	ssh server address (default "127.0.0.1:2222")
  -cmd string
    	command to run via system() (default "id > /tmp/.xz")
  -seed string
    	ed448 seed, must match xz backdoor key (default "0")
Let’s see now how we could use Tetragon to detect something by applying a Zero Trust strategy. At this stage we consider we don’t know anything about this vulnerability and we are using Tetragon as a security tool for our environment. Here we don’t use Kubernetes, we just have a Ubuntu 22.04 host but we can still use Tetragon by running it into a docker container.
We install docker in our machine by following the instructions described here:
root@Ubuntu22:~# sudo apt-get install ca-certificates curl
root@Ubuntu22:~# sudo install -m 0755 -d /etc/apt/keyrings
root@Ubuntu22:~# sudo curl -fsSL https://download.docker.com/linux/ubuntu/gpg -o /etc/apt/keyrings/docker.asc
root@Ubuntu22:~# sudo chmod a+r /etc/apt/keyrings/docker.asc

root@Ubuntu22:~# echo \
  "deb [arch=$(dpkg --print-architecture) signed-by=/etc/apt/keyrings/docker.asc] https://download.docker.com/linux/ubuntu \
  $(. /etc/os-release && echo "$VERSION_CODENAME") stable" | \
  sudo tee /etc/apt/sources.list.d/docker.list > /dev/null
root@Ubuntu22:~# sudo apt-get update

root@Ubuntu22:~# sudo apt-get install docker-ce docker-ce-cli containerd.io docker-buildx-plugin docker-compose-plugin
Then we install Tetragon in a docker container by following the instructions here:
root@Ubuntu22:~# docker run --name tetragon --rm -d \
    --pid=host --cgroupns=host --privileged \
    -v /sys/kernel:/sys/kernel \
    quay.io/cilium/tetragon:v1.0.3 \
    /usr/bin/tetragon --export-filename /var/log/tetragon/tetragon.log
Now everything is ready and we can trigger the backdoor and see what Tetragon can observe. We open a new shell by using the azureuser. We jump into the Tetragon container and monitor the log file for anything related to ssh as shown below:
azureuser@Ubuntu22:~$ sudo docker exec -it 76dc8c268caa bash
76dc8c268caa:/# tail -f /var/log/tetragon/tetragon.log | grep ssh
In another shell (the one with the root user), we can start the exploit by using the xzbot tool. We execute the command sleep 60 so we can observe in real time what is happening:
root@Ubuntu22:~/xzbot# ./xzbot -addr 127.0.0.1:22 -cmd "sleep 60"
This is an example of a malicious actor connecting through the backdoor to get a shell on our compromised Ubuntu machine. Below is what we can see in our Tetragon shell (the output has been copied and pasted for being parsed with jq to provide a better reading and we’ve kept only the process execution event):
{
  "process_exec": {
    "process": {
      "exec_id": "OjIwNjAyNjc1NDE0MTU2OjE1NDY0MA==",
      "pid": 154640,
      "uid": 0,
      "cwd": "/",
      "binary": "/usr/sbin/sshd",
      "arguments": "-D -R",
      "flags": "execve rootcwd clone",
      "start_time": "2024-04-23T12:03:08.447280556Z",
      "auid": 4294967295,
      "parent_exec_id": "OjE0MTYwMDAwMDAwOjc0Mg==",
      "tid": 154640
    },
    "parent": {
      "exec_id": "OjE0MTYwMDAwMDAwOjc0Mg==",
      "pid": 742,
      "uid": 0,
      "cwd": "/",
      "binary": "/usr/sbin/sshd",
      "flags": "procFS auid rootcwd",
      "start_time": "2024-04-23T06:19:59.931865800Z",
      "auid": 4294967295,
      "parent_exec_id": "OjM4MDAwMDAwMDox",
      "tid": 742
    }
  },
  "time": "2024-04-23T12:03:08.447279856Z"
}
...
{
  "process_exec": {
    "process": {
      "exec_id": "OjIwNjAyOTk4NzY3ODU0OjE1NDY0Mg==",
      "pid": 154642,
      "uid": 0,
      "cwd": "/",
      "binary": "/bin/sh",
      "arguments": "-c \"sleep 60\"",
      "flags": "execve rootcwd clone",
      "start_time": "2024-04-23T12:03:08.770634054Z",
      "auid": 4294967295,
      "parent_exec_id": "OjIwNjAyNjc1NDE0MTU2OjE1NDY0MA==",
      "tid": 154642
    },
    "parent": {
      "exec_id": "OjIwNjAyNjc1NDE0MTU2OjE1NDY0MA==",
      "pid": 154640,
      "uid": 0,
      "cwd": "/",
      "binary": "/usr/sbin/sshd",
      "arguments": "-D -R",
      "flags": "execve rootcwd clone",
      "start_time": "2024-04-23T12:03:08.447280556Z",
      "auid": 4294967295,
      "parent_exec_id": "OjE0MTYwMDAwMDAwOjc0Mg==",
      "tid": 154640
    }
  },
  "time": "2024-04-23T12:03:08.770633854Z"
}
Here we have all the interesting information about the process as well as the link to its parent process. With Tetragon Entreprise we could have a graphical view of these linked processes. As we are using the Community Edition, we can use the ps command instead here to get a more graphical view as shown below:
azureuser@Ubuntu22:~$ ps -ef --forest
root         742       1  0 06:19 ?        00:00:00 sshd: /usr/sbin/sshd -D [listener] 1 of 10-100 startups
root      154640     742  2 12:03 ?        00:00:00  \_ sshd: root [priv]
sshd      154641  154640  0 12:03 ?        00:00:00      \_ sshd: root [net]
root      154642  154640  0 12:03 ?        00:00:00      \_ sh -c sleep 60
root      154643  154642  0 12:03 ?        00:00:00          \_ sleep 60
The 2 processes highlighted above are those related to the Tetragon output. Let’s now see what Tetragon displays in case of a normal ssh connection.
Tetragon – Normal ssh connectionWe first need to setup a pair of keys for the root user (to better compare it with the output above):
root@Ubuntu22:~# ssh-keygen

root@Ubuntu22:~# cat ~/.ssh/id_rsa.pub > ~/.ssh/authorized_keys

root@Ubuntu22:~# ssh root@127.0.0.1
Welcome to Ubuntu 22.04.4 LTS (GNU/Linux 6.5.0-1017-azure x86_64)
For the key generation we use the default folder with no passphase. We see we can connect with the root user to the localhost by using the generated keys. We can then use the same method as above to launch Tetragon and the ps command to capture this ssh connection. Here is what we can see with Tetragon:
{
  "process_exec": {
    "process": {
      "exec_id": "OjU1ODY3OTQ0NTI0ODY6NDc1MDE=",
      "pid": 47501,
      "uid": 0,
      "cwd": "/",
      "binary": "/usr/sbin/sshd",
      "arguments": "-D -R",
      "flags": "execve rootcwd clone",
      "start_time": "2024-04-23T07:52:52.566318686Z",
      "auid": 4294967295,
      "parent_exec_id": "OjE0MTYwMDAwMDAwOjc0Mg==",
      "tid": 47501
    },
    "parent": {
      "exec_id": "OjE0MTYwMDAwMDAwOjc0Mg==",
      "pid": 742,
      "uid": 0,
      "cwd": "/",
      "binary": "/usr/sbin/sshd",
      "flags": "procFS auid rootcwd",
      "start_time": "2024-04-23T06:19:59.931865800Z",
      "auid": 4294967295,
      "parent_exec_id": "OjM4MDAwMDAwMDox",
      "tid": 742
    }
  },
  "time": "2024-04-23T07:52:52.566318386Z"
}

{
  "process_exec": {
    "process": {
      "exec_id": "OjU1ODgxMzk5MjM5NjA6NDc2MDQ=",
      "pid": 47604,
      "uid": 0,
      "cwd": "/root",
      "binary": "/bin/bash",
      "flags": "execve clone",
      "start_time": "2024-04-23T07:52:53.911790360Z",
      "auid": 0,
      "parent_exec_id": "OjU1ODY3OTQ0NTI0ODY6NDc1MDE=",
      "tid": 47604
    },
    "parent": {
      "exec_id": "OjU1ODY3OTQ0NTI0ODY6NDc1MDE=",
      "pid": 47501,
      "uid": 0,
      "cwd": "/",
      "binary": "/usr/sbin/sshd",
      "arguments": "-D -R",
      "flags": "execve rootcwd clone",
      "start_time": "2024-04-23T07:52:52.566318686Z",
      "auid": 4294967295,
      "parent_exec_id": "OjE0MTYwMDAwMDAwOjc0Mg==",
      "tid": 47501
    }
  },
  "time": "2024-04-23T07:52:53.911789660Z"
}
And the output of the corresponding ps command:
azureuser@Ubuntu22:~$ ps -ef --forest
root         742       1  0 06:19 ?        00:00:00 sshd: /usr/sbin/sshd -D [listener] 0 of 10-100 startups
root       45501     742 10 07:49 ?        00:00:00  \_ sshd: root@pts/1
root       47604   45501  0 07:49 pts/1    00:00:00      \_ -bash
You can see there is a difference but it is not easy to spot! In the normal connection it launches a bash under sshd and through the backdoor it is running a command with sh instead.
Wrap upWe have seen how we can leverage Tetragon to observe anything happening on this machine. Even for unknown threats, you get some information but you have to know first how your system is working in very details. You need to have a baseline for each running process on your machine to be able to detect any deviation. That is what we call the Zero Trust strategy and it is the only way to detect such stealthy backdoor.
It may seem tenuous and it is, however that is how Andres Freund discovered it when he noticed ssh was several milliseconds slower than it should. The famous adage says that the devil is in the detail, this backdoor discovery proves that this is especially true when it comes to security.
L’article Detect XZ Utils CVE 2024-3094 with Tetragon est apparu en premier sur dbi Blog.